
Assignment 5
Sensors and Input Devices
Sensors in Mobiles
Touch Screen Sensor- Capacitive touch screen that has an electric current going through layers of glass so that when one touches the screen it causes a change in the electric signals. The device thus figures out where one has touched on the screen. It can also detect multiple touches, enabling multi-touch gestures.
Accelerometer- Detects change in position in different directions. In a phone, this is used to detect the orientation of the phone.
Gyroscope- Detects rotation of the phone.
Digital Compass/Magnetometer- Allows the phone to know which way is north to auto-rotate maps.
Barometer- Senses pressure to determine altitude.
Proximity sensor- Used to detect when the phone is held up to the ear to switch off the display.
In-Display fingerprint sensor- Optical sensors are used for this. The screen lights up when you touch the area and records the information.
Pulse Oximeter- Can be used by having a relevant app. It records the blood oxygen level, it can also tell the heart rate.
Pedometer- Sensor which counts the number of steps a person is taking. This is done using the accelerometer to sense the number of tilts to either side from the normal position(that occurs when one is walking).
Geiger Counter- Can be used to measure radioactivity radiation levels in a particular area.
(Can use the data in google maps as a sensor data)
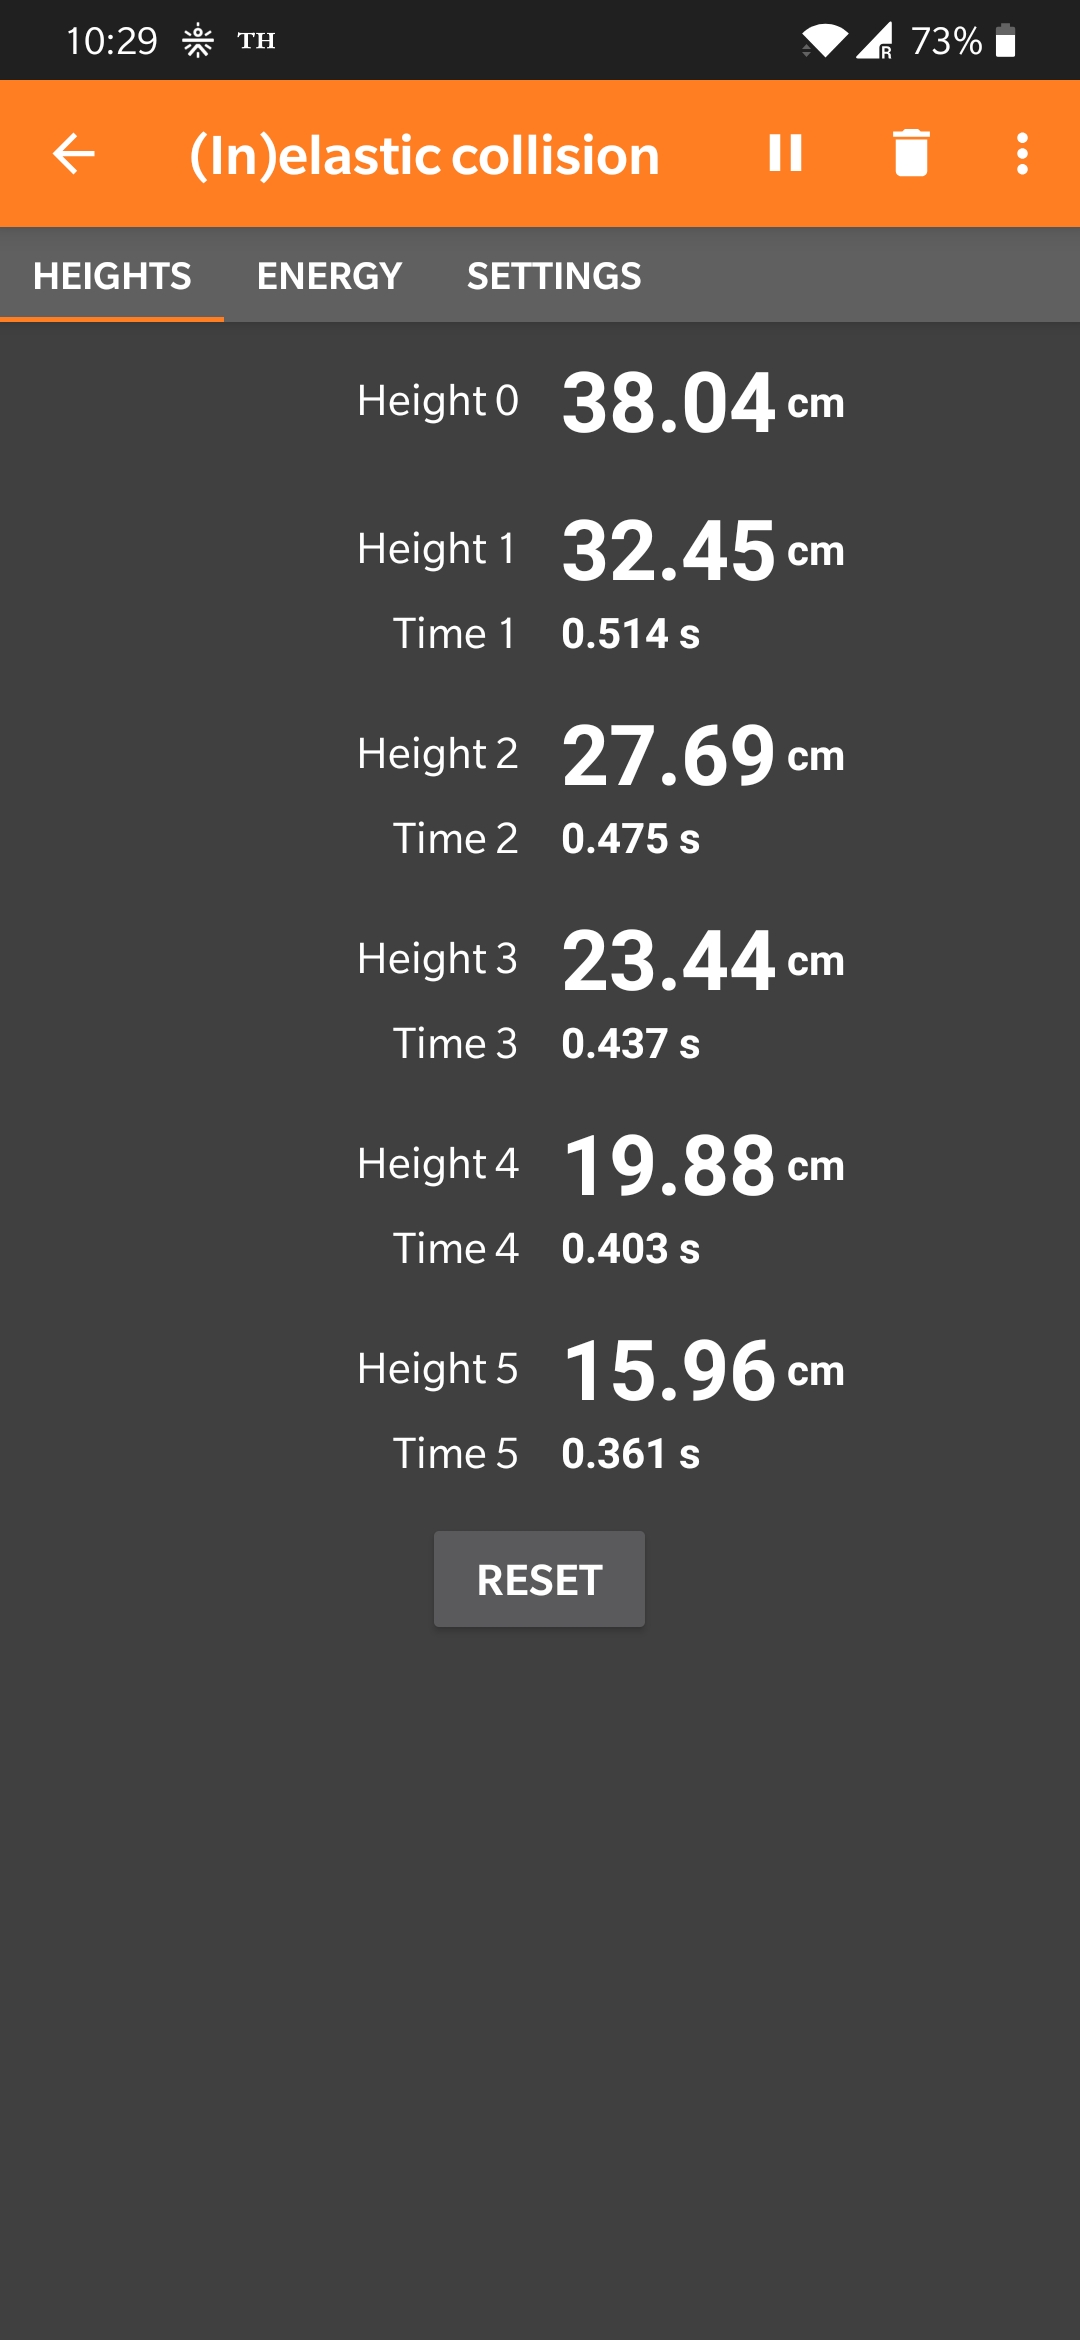
Experiment using mobile-Inelastic collision
After installing the Phyphox application conduct the inelastic collision experiment. Start the timer on the application and bounce a ball on a surface that it makes a sound with each impact. The application records the height of each consecutive bounce and time between each bounce as shown in the screenshot below.
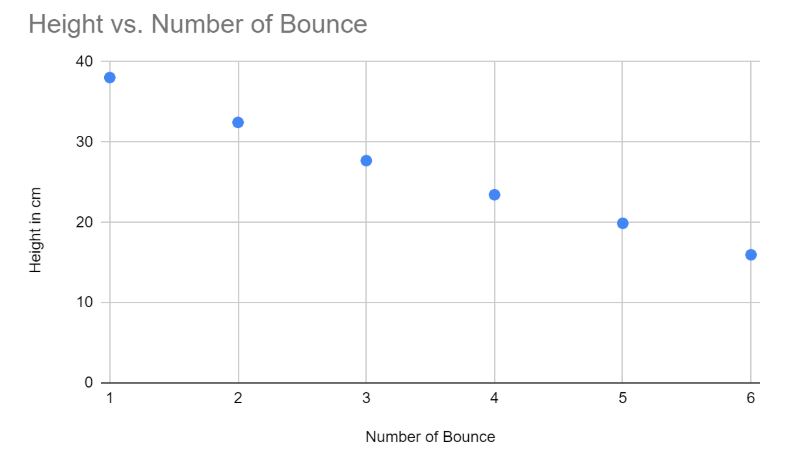
The graph of heights of each bounce to the number of the bounce is shown below.
Input devices
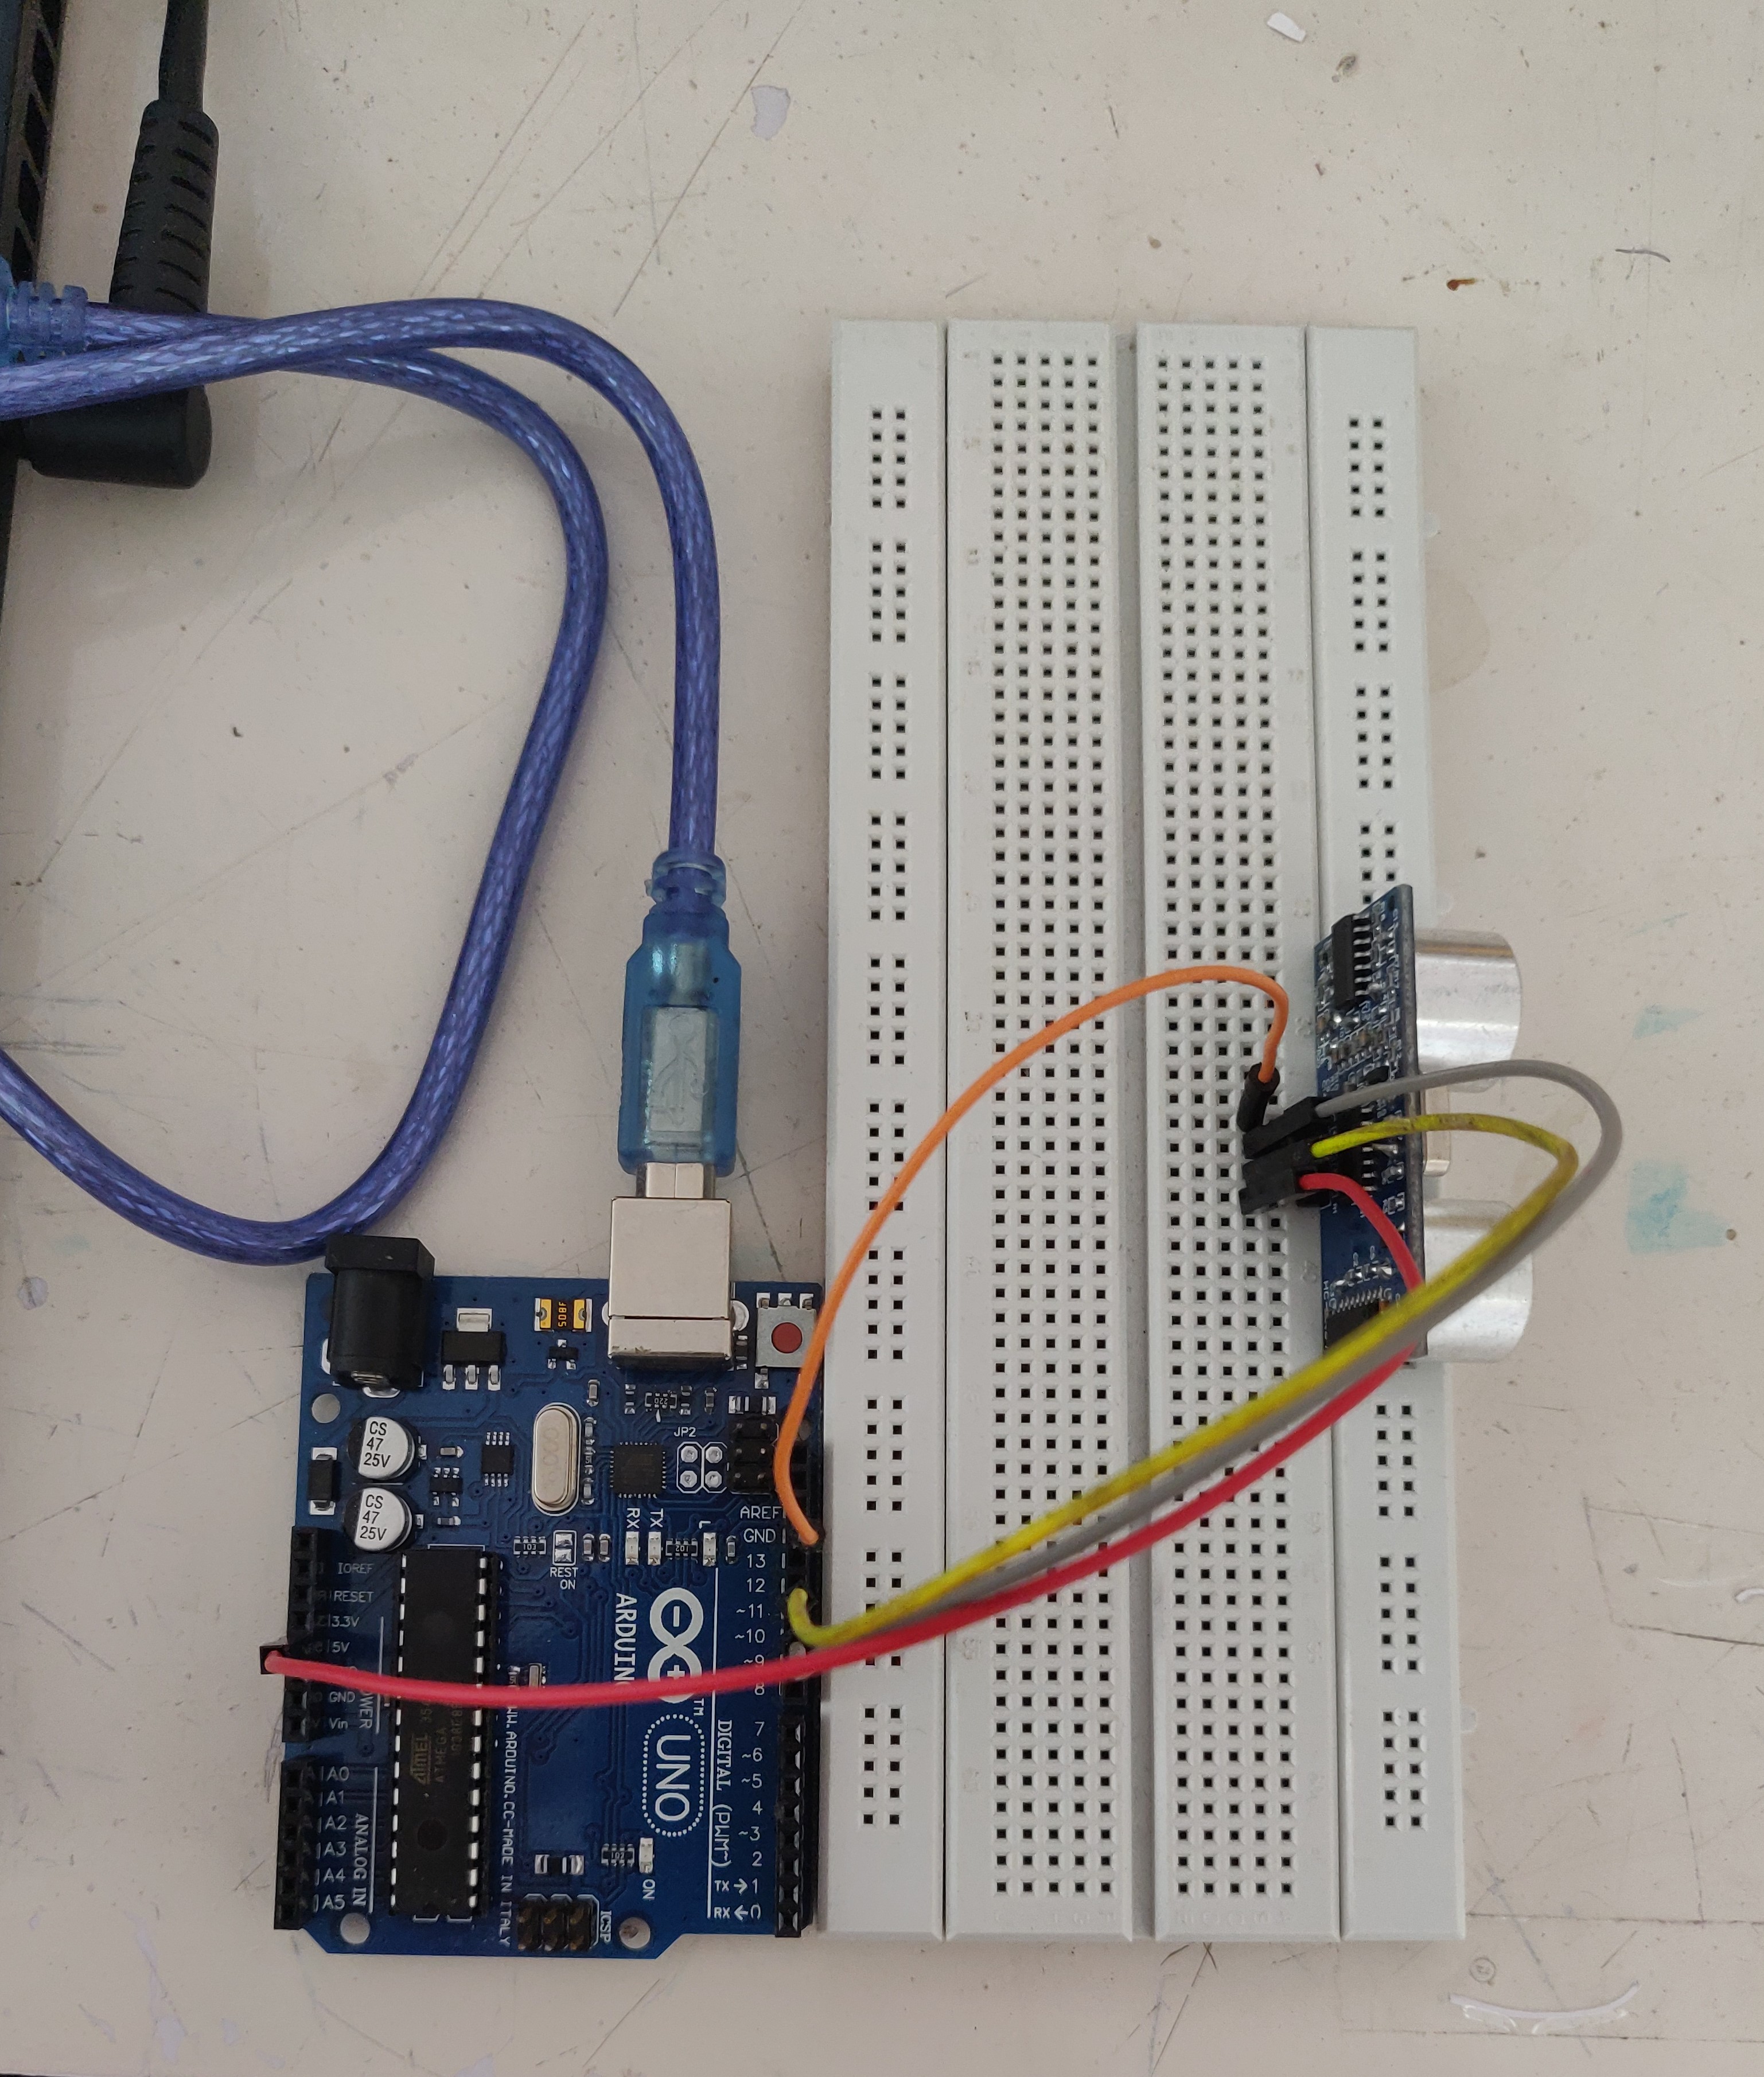
First, connect the ultrasonic sensor to the Arduino as shown in the image below.
Second, use the following code to measure the distance of the object in front of the sensor.
Code
Third open serial monitor and bring an object closer to the sensor. Keep the time stamp on to show distance data at different times.
Fourth copy data from the serial monitor to a document to save data. The graph of the distance to the time elapsed is shown below.
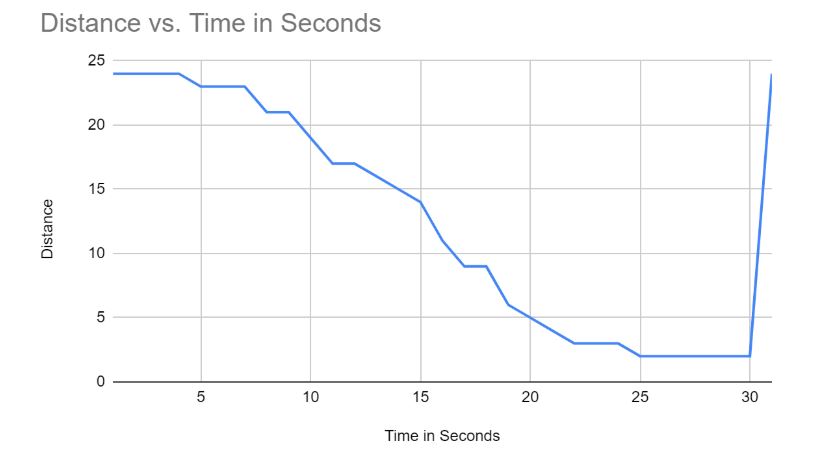
The distance starts at 24 which shows the distance of the cubicle and goes back to showing that distance when the obstacle (book) is removed.
Connecting the sensor to a beeper to beep at a certain distance can also be used as a parking assist in vehicles. The video below demonstrates the experiment.