Data Science
Public School Education in Uttar Pradesh
Motivation
Our country is still struggling with public school education system. Public school systems are the most fundamental sources of education for many low income communities and people who live in remote areas. Not to mention, economic aims for a country are dependent on education systems and in a country where around 70% of population is rural, public schools are the only resort for millions of people to gain edcuation.However, as we all know public education systems are not the best producers of knowledge or even uplifters of low-income class. Governments always boast about their education funding and newer learning aids available to public schools yet this sector is not growing since last decade or two. In this assignment, I will try to analyse what is it that affects education the most ? Is it teachers, infrastructure, hygiene, enrollment, community representation etc. For the analysis, I have chosen to study Uttar Pradesh public schools and look for factors that really affect education. Also, this analysis includes region wise (urban/rural) effects and representation of girls in schools.
Model
Education is not as linear as we imagine it to be. Quanitfying education is a tough task and cannot be done by some simple metric. However, for our analysis we will choose results as a metric which tells us about the impact of a particular school. There are a lot of other parameters which are used to describe education (Learning outcomes, attendance etc.) but I will use results as a target variable here as it is easily quanitifiable. The features we will be using with results would be-
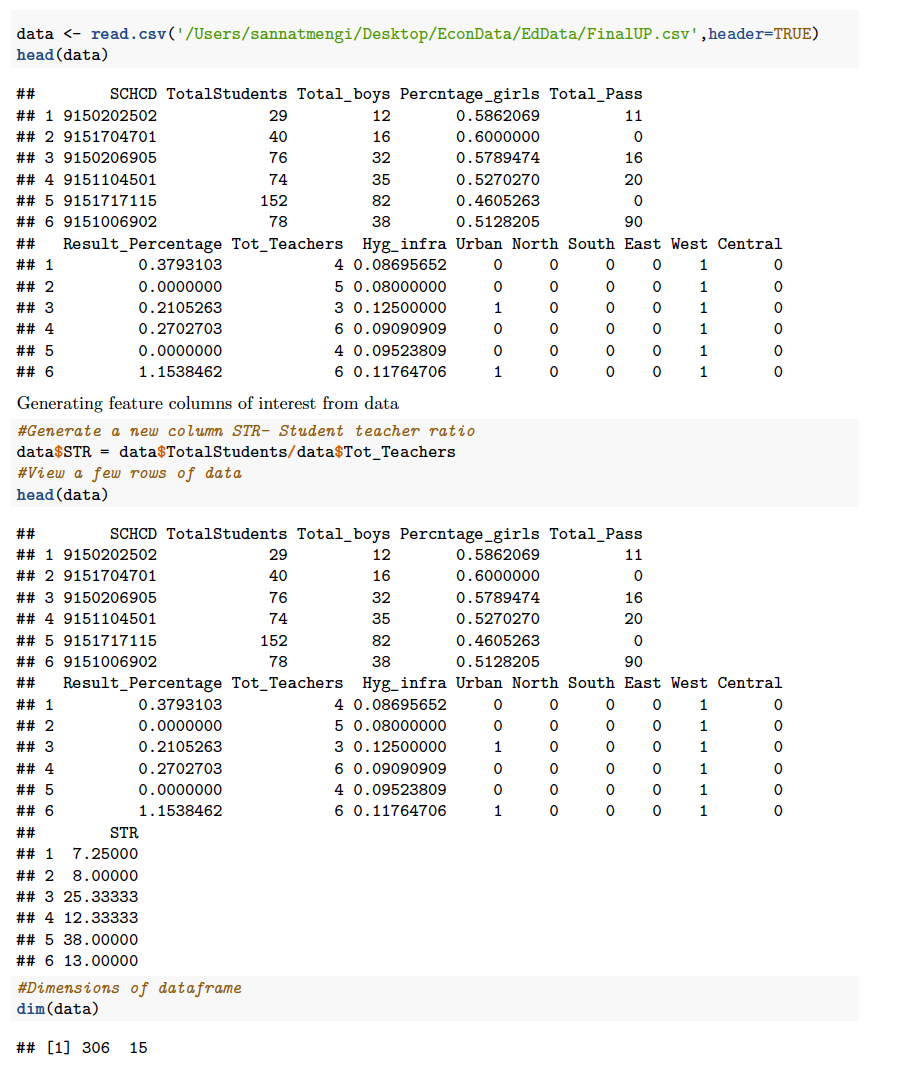
- Student teacher ratio (STR)- measures effect of teachers on students
- Hygiene (hyg) - A ratio of total bathrooms in school to total rooms in school. It highlights funding as well
- Percentage of girls (prcntgrl)- Measures respresentation of girls in school
- Urban (urban)- a dummy variable with value 1 for urban schools and value 0 for rural schools
 u signifies error term for our regression model and it captures all the variables apart from feature variables listed in model.For e.g. u can signify the affect of society, economic status of parents, school teacher’s credibility etc. STR squared term is added to include a simple squared interaction term. Linear regression model is computed using R.
Data preprocessing
Data for districts is compiled from DISE (District Information System of Education) under National University of Education and Planning (NUEPA). Preliminary data merging, manipulation and cleaning is done on MS Excel for raw data files.
 After observing, there is faulty data too in our file. Such as many rows have Result_percentage=0. However,
this might be faulty data or can be truth as well because it is highly unlikely for a school to have 0% as it’s result. So for uniformity of our analysis, we will drop the rows with Result_Percentage=0.
After observing, there is faulty data too in our file. Such as many rows have Result_percentage=0. However,
this might be faulty data or can be truth as well because it is highly unlikely for a school to have 0% as it’s result. So for uniformity of our analysis, we will drop the rows with Result_Percentage=0.
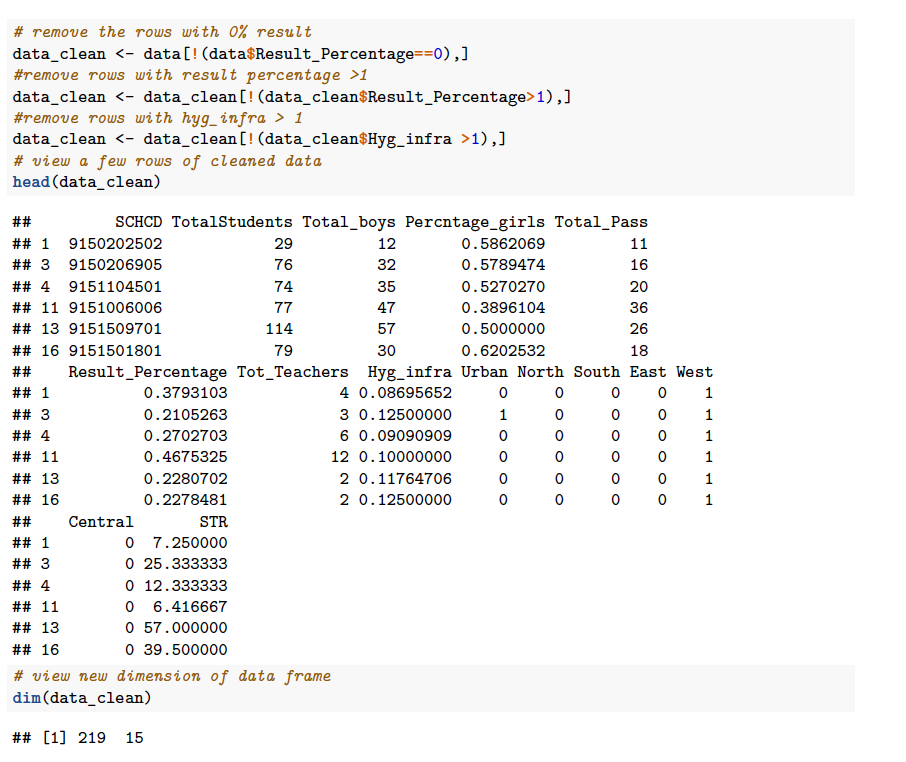 No. of rows get reduced from 306 to 219 after removing spurious rows.
Exploratory data analysis
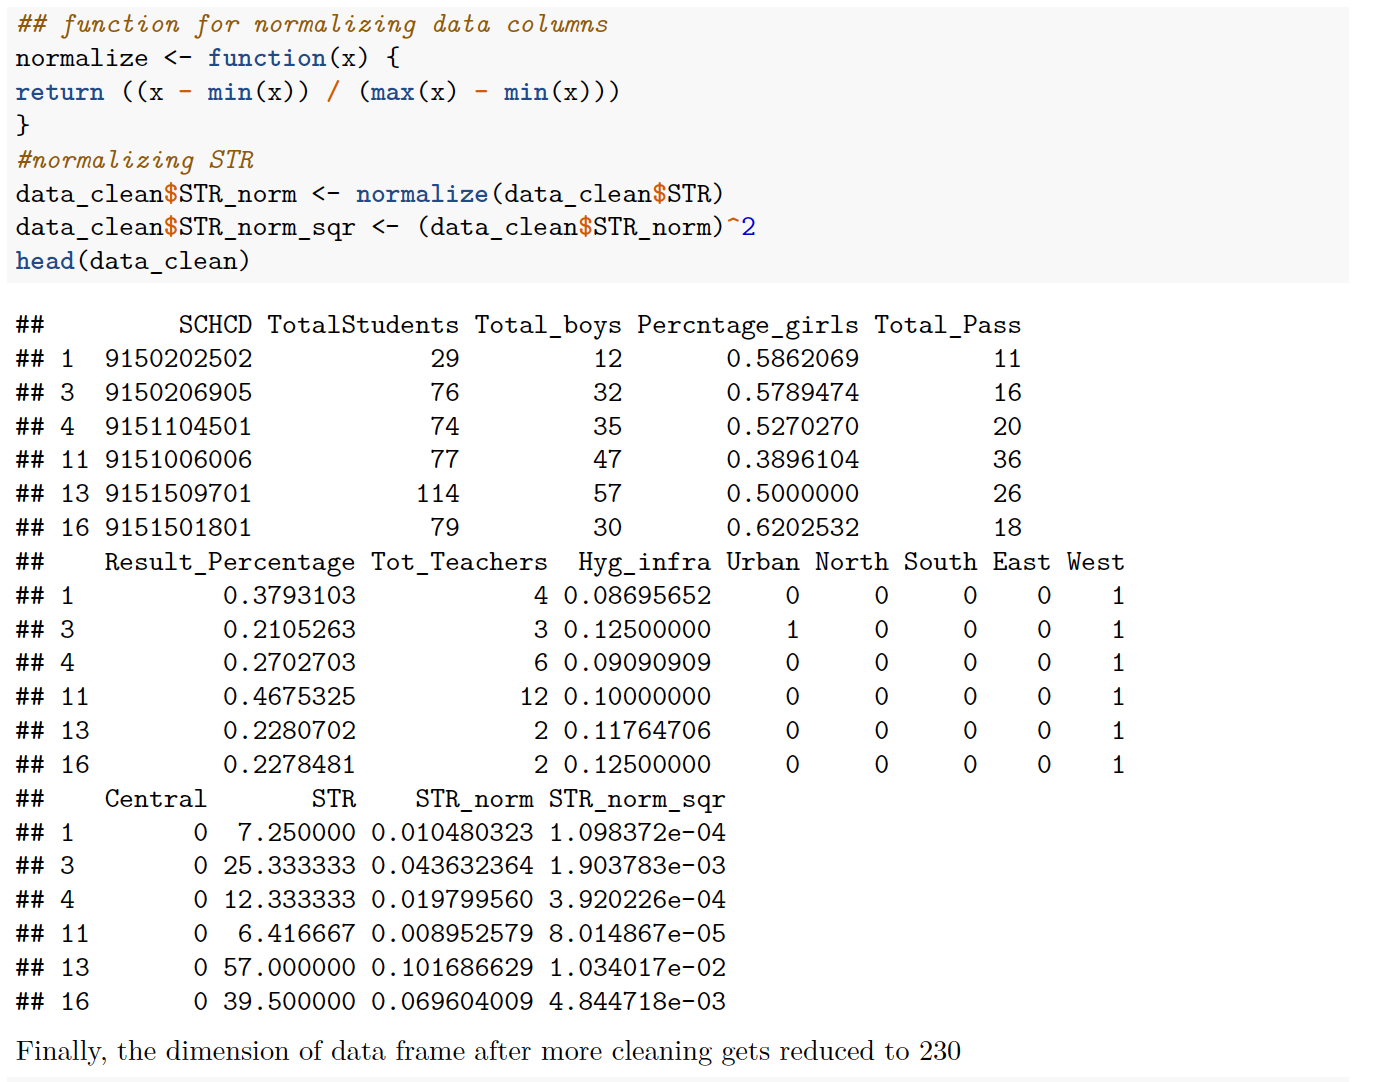
 Variable STR needs to be normalized to be in scale with other variables. Also, variable Result_precentage
cannot be grater than 1.Result percentage greater than 100% must be due to error in data entry, hence it
needs to be removed too.
Variable STR needs to be normalized to be in scale with other variables. Also, variable Result_precentage
cannot be grater than 1.Result percentage greater than 100% must be due to error in data entry, hence it
needs to be removed too.
 After the data is corrected, EDA of target variables vs feature variables can give an idea about signs of coefficients in model and the kind of correlation between two variables.
 From EDA following insights can be inferred-
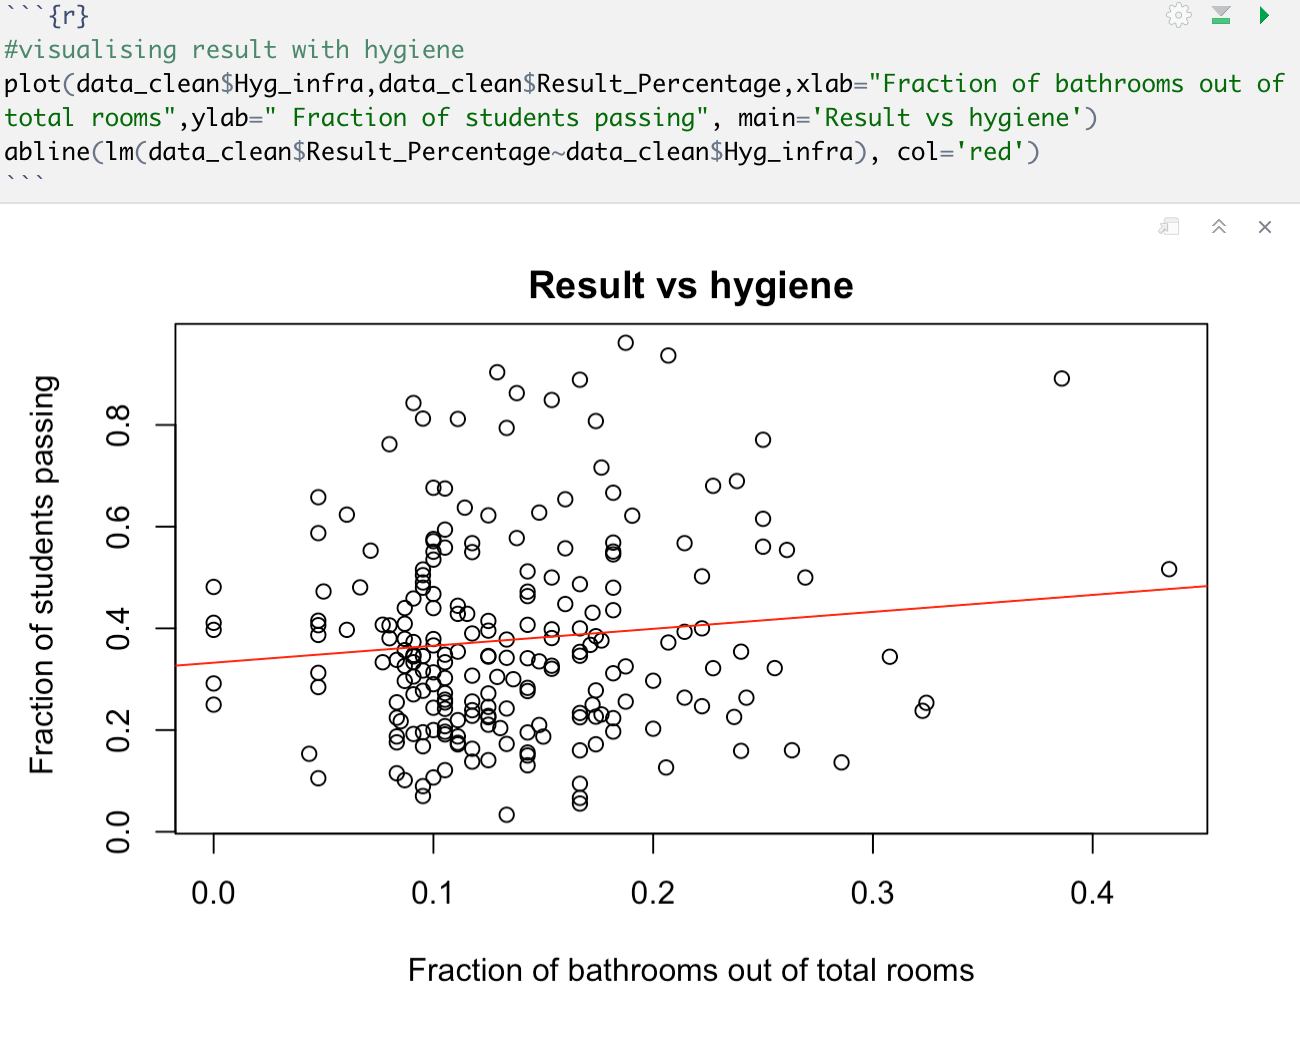
- Results increase with increase in hygiene facilities
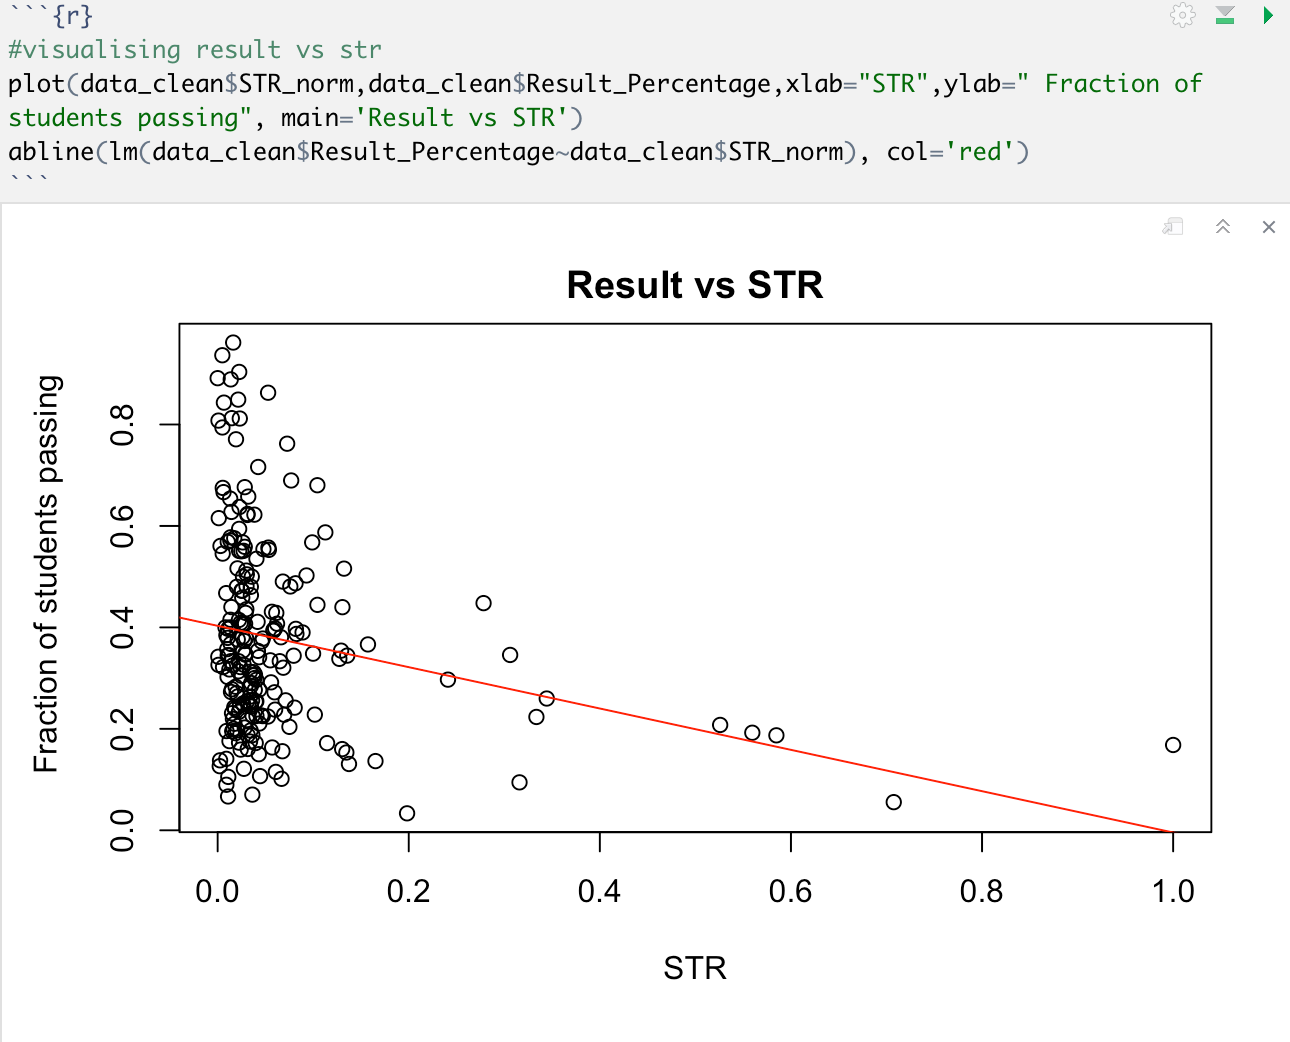
- Results decrease with increase in Student teacher ratio
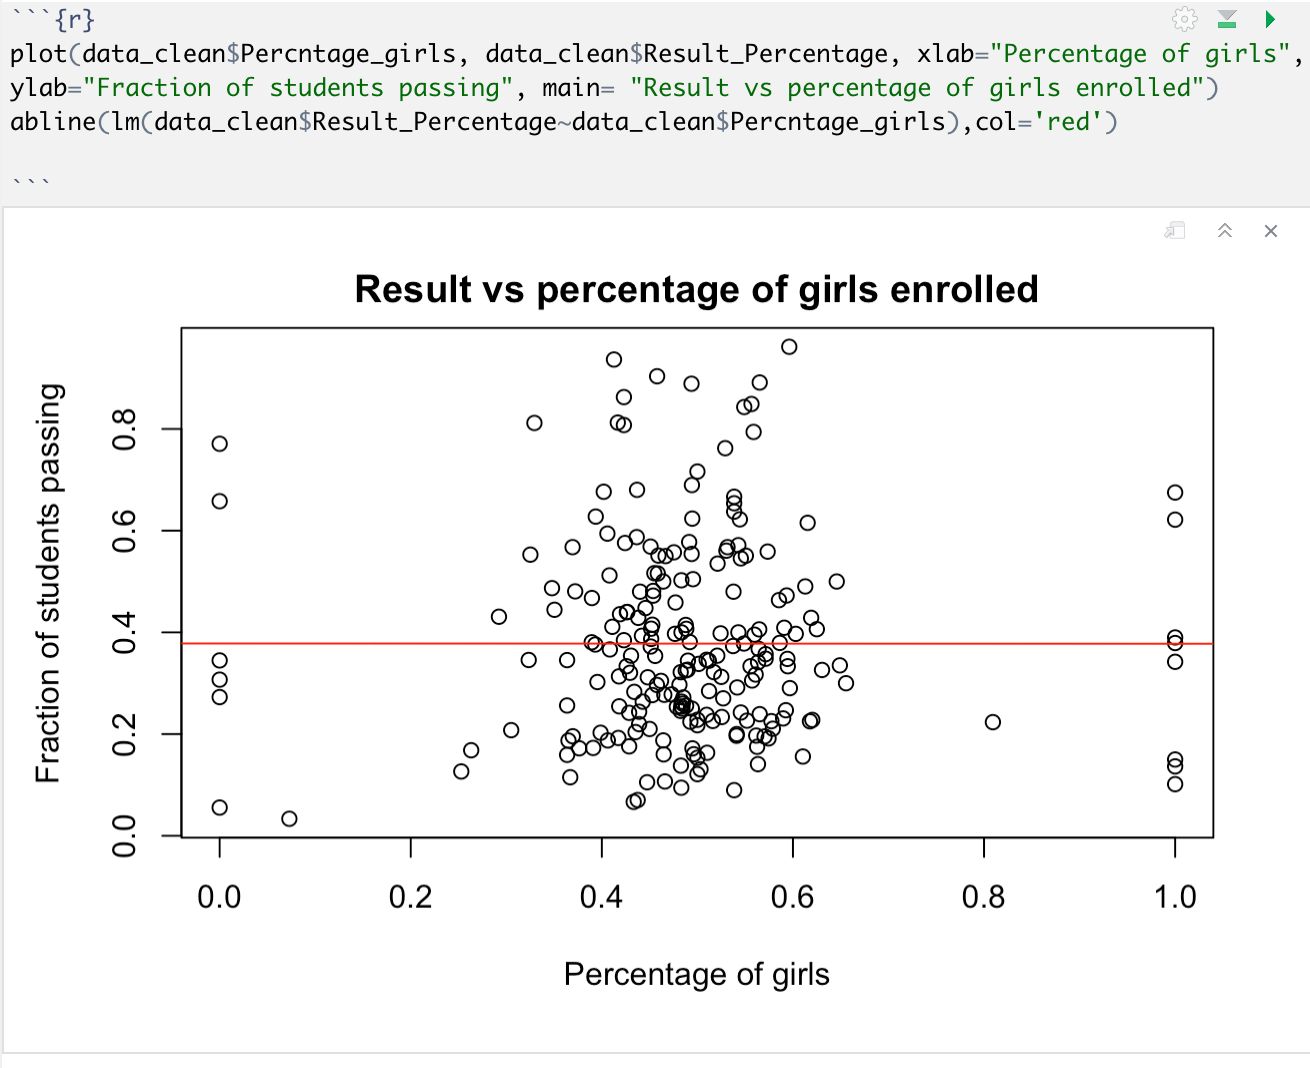
- No particular comment can be inferred from Result vs girl enrollment curve. The line is having a very less slope or maybe insignificant
Results:Regressing the model
Inferences
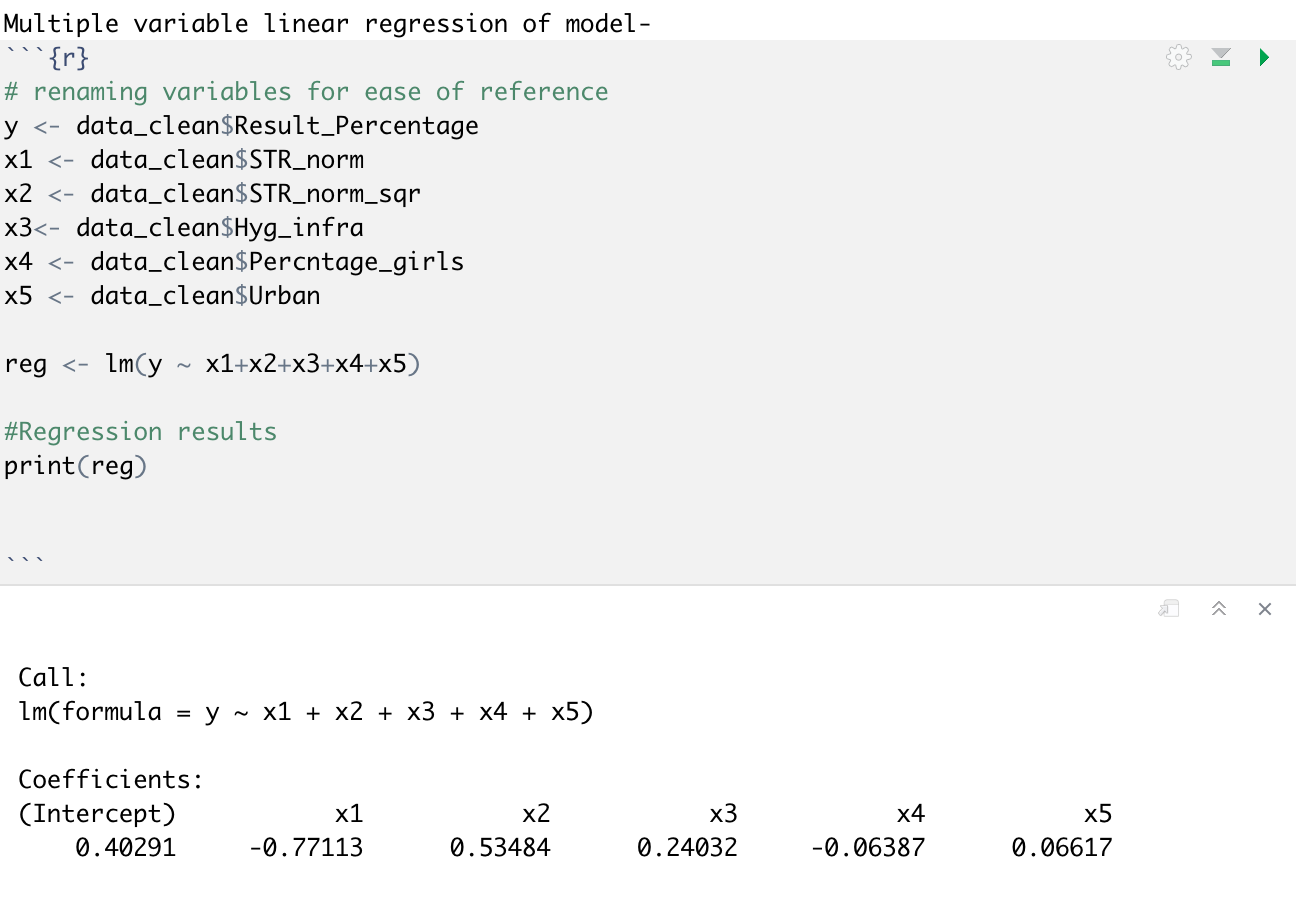
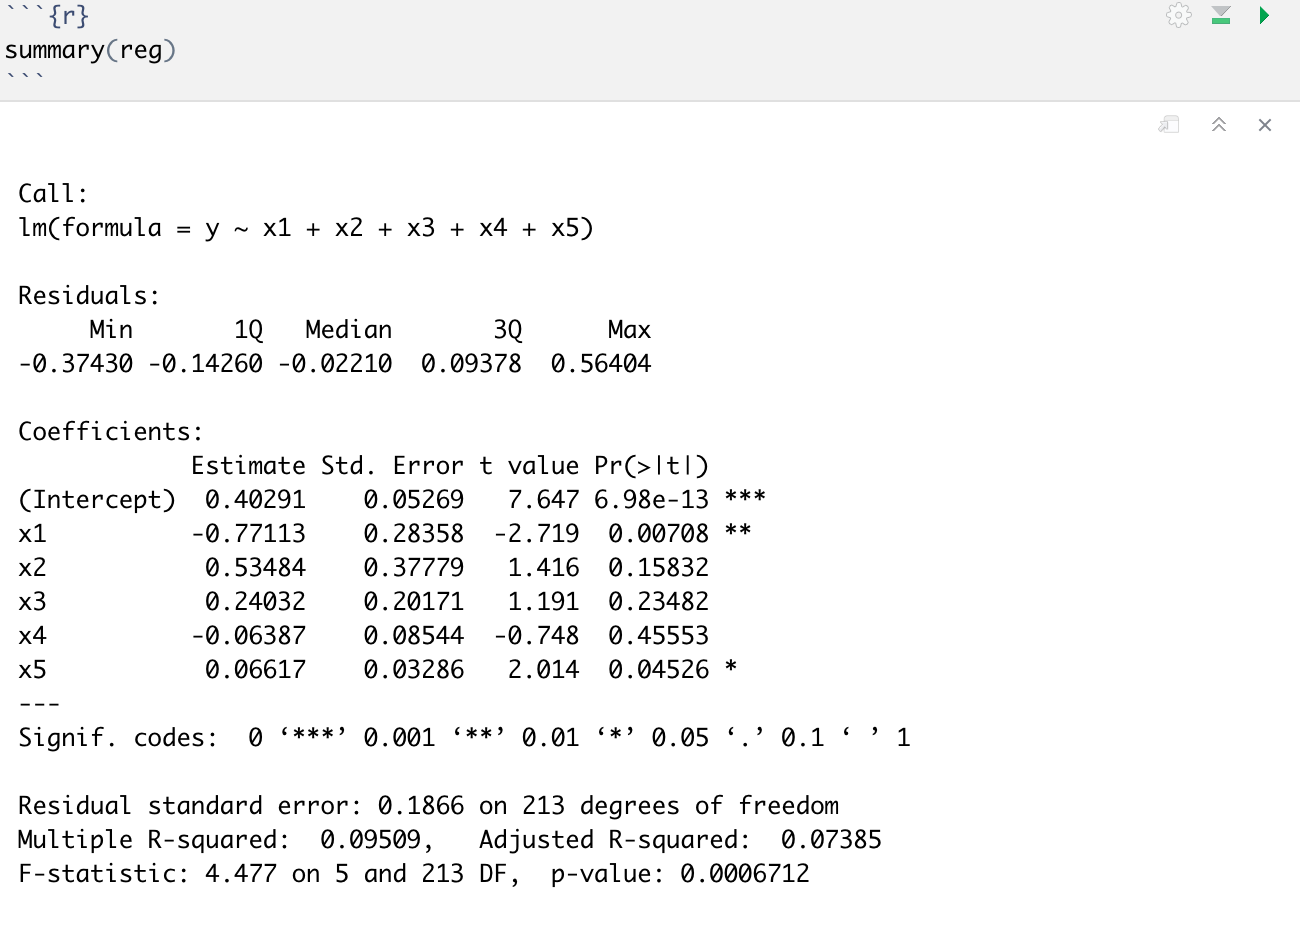
Following inferences can be drawn from model results-
- Only STR(Student teacher ratio), intercept and urban/rural dummy variable are statistically significant variable. i.e t-test statistic > critical value at 5% significance level
- Other variables are not that statistically significant for result prediction
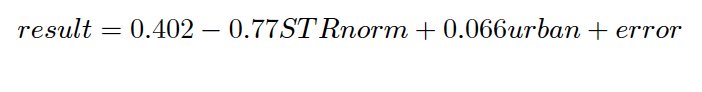
- Coefficient of STR indicates that an increase of 0.1 units in normalized STR leads to reduction of 0.077 units in fraction of students passing. This coefficient is quite huge and highlights the importance of a healthy student teacher ratio
- STR^2, hyg, prcntgirl are not statistically significant variables and can be removed from model as well
- Coefficient of urban shows that there is a difference of 0.066 units in fraction of students passing from ubran and rural schools. While this is quite intuitive, but the difference is not that large. This also indicates that the society influence on education is not very different in Uttar Pradesh
-
We can use the model to predict any fraction of students passing from a school
Improvements
- OLS estimates are unbiased and consistent only when independent and identically distributed random samples are taken. The data chosen is truly random or biased is not clear and depends upon the source as well. Sample data extracted can be randomised further. Features maybe highly correlated as well
- Functional form of linear model can be imporved using interaction terms, log values, and polynomial expressions
- The fit of data is very poor. Adjusted R-squared for model is just 7.3%. Some more investigation into model fit needs to be done
- Other feature variables such as avaialbility of extra teaching aids, extra-curricular activities, economic status (funding) of school can also be explored to study effects of these variables.
References