Assignment 03: Data Analysis using MATLAB
Introduction to Problem
For the Assignment 03, I took 'Three' Datasets: GDI data (from 1990 to 2019), HDI data (from 1990 to 2019) and life expectancy data (from 1990 to 2019). My objective for this assignment is to find the inter-relation of all the 3 parameters of different countries, are the parameters related i.e if a country performs good in one criterion means it's also doing good in other criterions as well.
Variables under Study
- Life expectancy : It estimate of the average number of additional years that a person of a given age can expect to live. The most common measure of life expectancy is life expectancy at birth. Life expectancy is a hypothetical measure. It assumes that the age-specific death rates for the year in question will apply throughout the lifetime of individuals born in that year. The estimate, in effect, projects the age-specific mortality (death) rates for a given period over the entire lifetime of the population born (or alive) during that time. The measure differs considerably by sex, age, race, and geographic location. Therefore, life expectancy is commonly given for specific categories, rather than for the population in general. For example, the life expectancy for white females in the United States who were born in 2003 is 80.4 years.
Life expectancy reflects local conditions. In less-developed countries, life expectancy at birth is relatively low, compared with more-developed countries. In some less-developed countries, life expectancy at birth may be lower than life expectancy at age 1, because of high infant mortality rates (commonly due to infectious disease or lack of access to a clean water supply).
- HDI (Human Development Index) : It is a summary measure for assessing long-term progress in three basic dimensions of human development: a long and healthy life, access to knowledge and a decent standard of living. A long and healthy life is measured by life expectancy. Knowledge level is measured by mean years of schooling among the adult population, which is the average number of years of schooling received in a life-time by people aged 25 years and older; and access to learning and knowledge by expected years of schooling for children of school-entry age, which is the total number of years of schooling a child of school-entry age can expect to receive if prevailing patterns of age-specific enrolment rates stay the same throughout the child's life. Standard of living is measured by Gross National Income (GNI) per capita expressed in constant 2017 international dollars converted using purchasing power parity (PPP) conversion rates.
To ensure as much cross-country comparability as possible, the HDI is based primarily on international data from the United Nations Population Division (the life expectancy data), the United Nations Educational, Scientific and Cultural Organization Institute for Statistics (the mean years of schooling and expected years of schooling data) and the World Bank (the GNI per capita data). As stated in the introduction, the HDI values and ranks in this year’s report are not comparable to those in past reports because of some revisions to the component indicators. To allow for assessment of progress in HDIs, the 2020 Human Development Report includes recalculated HDIs from 1990 to 2019 using consistent series of data.
- GDI (Gender Development Index) : In the 2014 Human Development Report, HDRO introduced a new measure, the GDI, based on the sex-disaggregated Human Development Index, defined as a ratio of the female to the male HDI. The GDI measures gender inequalities in achievement in three basic dimensions of human development: health (measured by female and male life expectancy at birth), education (measured by female and male expected years of schooling for children and mean years for adults aged 25 years and older) and command over economic resources (measured by female and male estimated GNI per capita). For details on how the index is constructed refer to Technical Note 3. Country groups are based on absolute deviation from gender parity in HDI. This means that the grouping takes into consideration inequality in favour of men or women equally.
Sources of Data
Software Used
MATLAB ONLINE
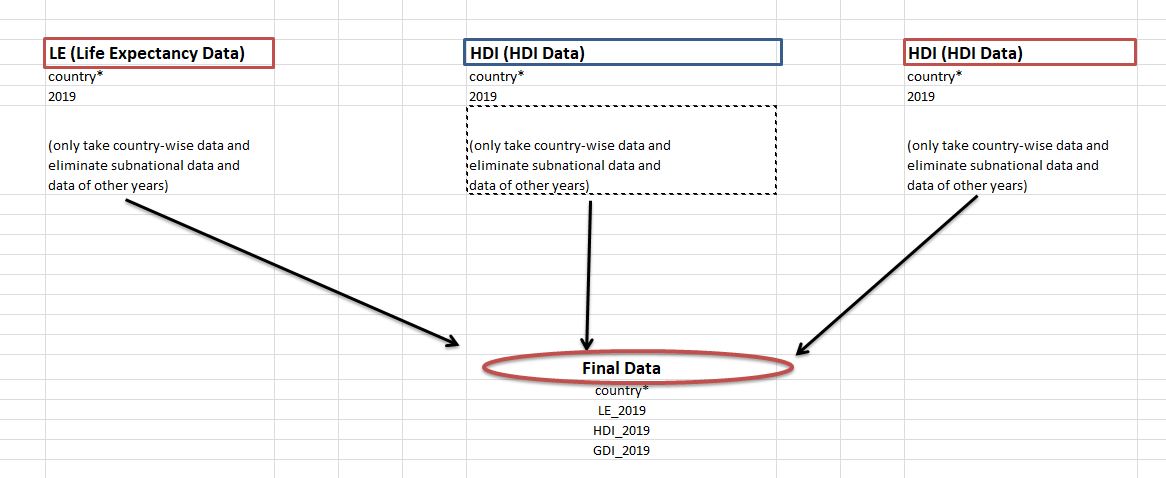
Rough Schema
Processing Data
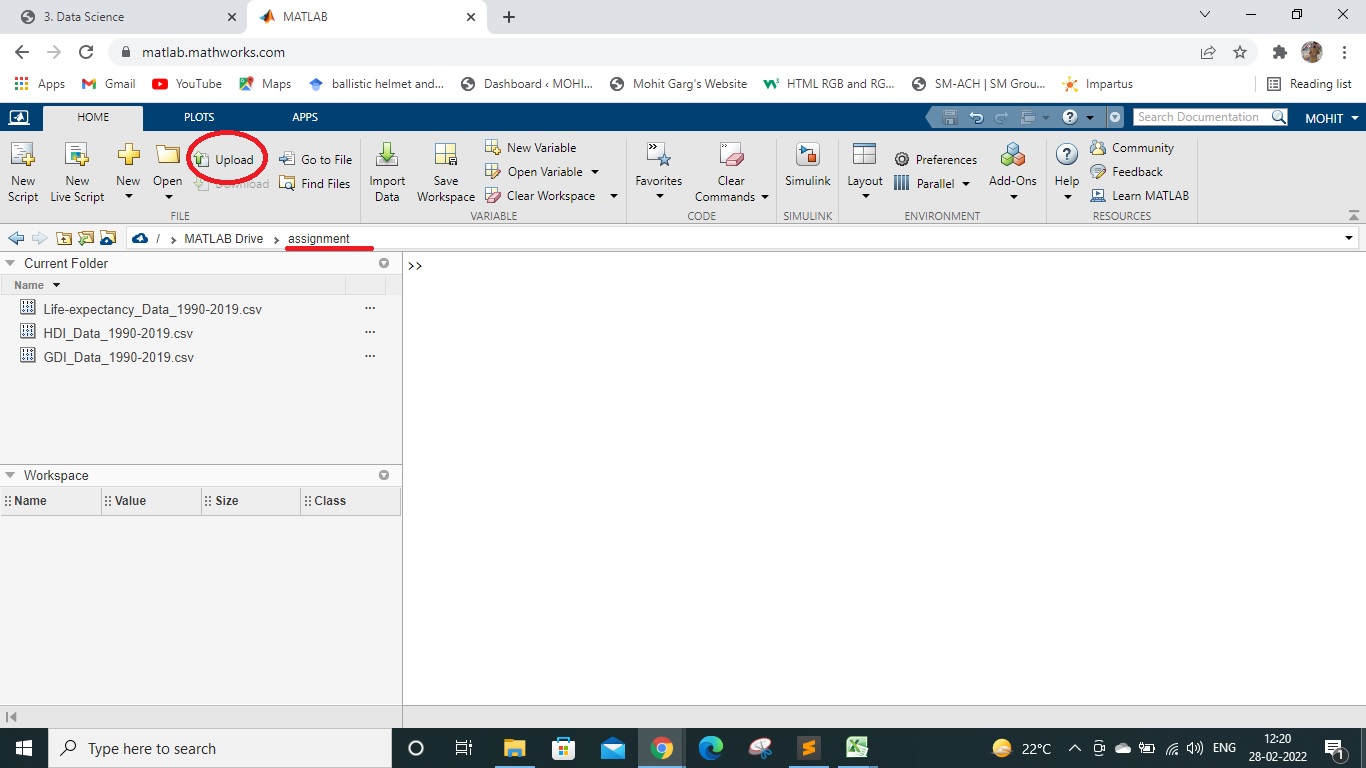
- First step was to login in the MATLAB online account and uploading the 3 'csv' files into a newly made folder named 'Assignment'
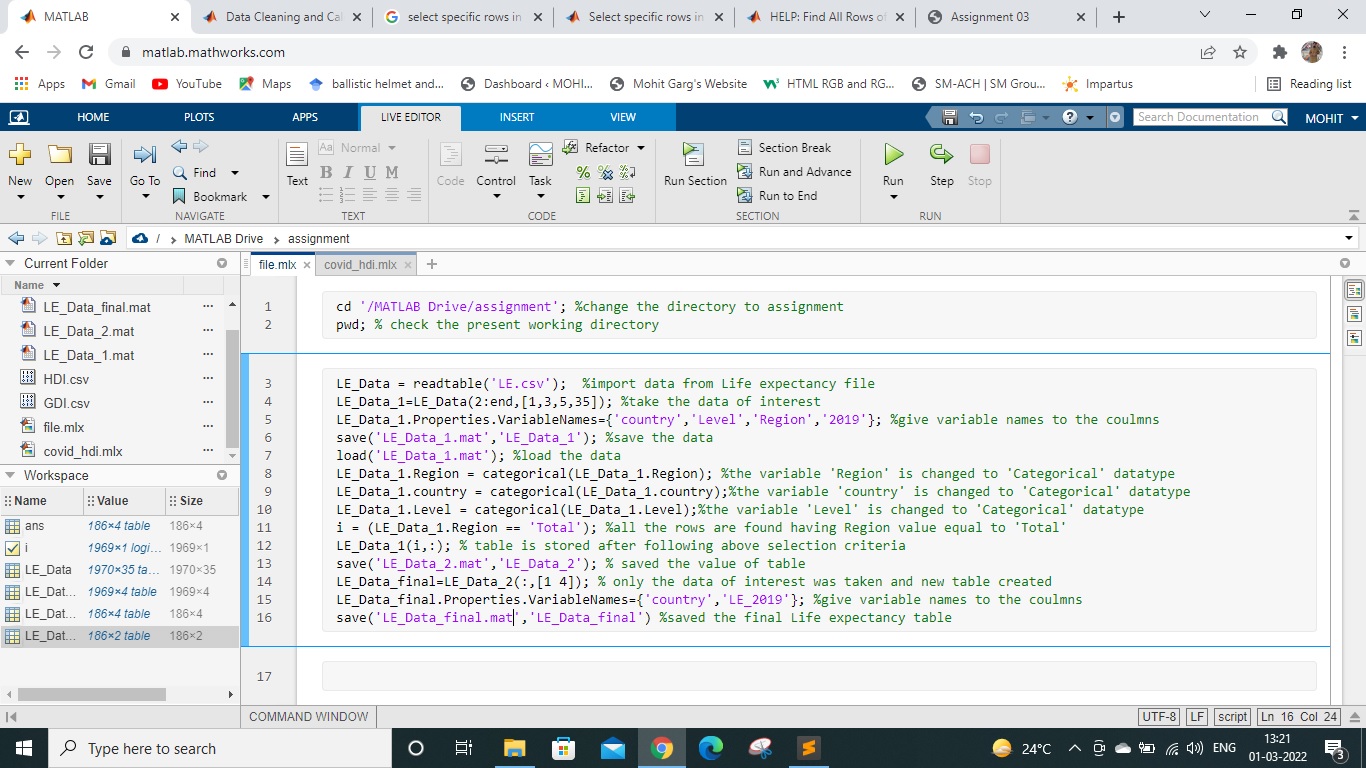
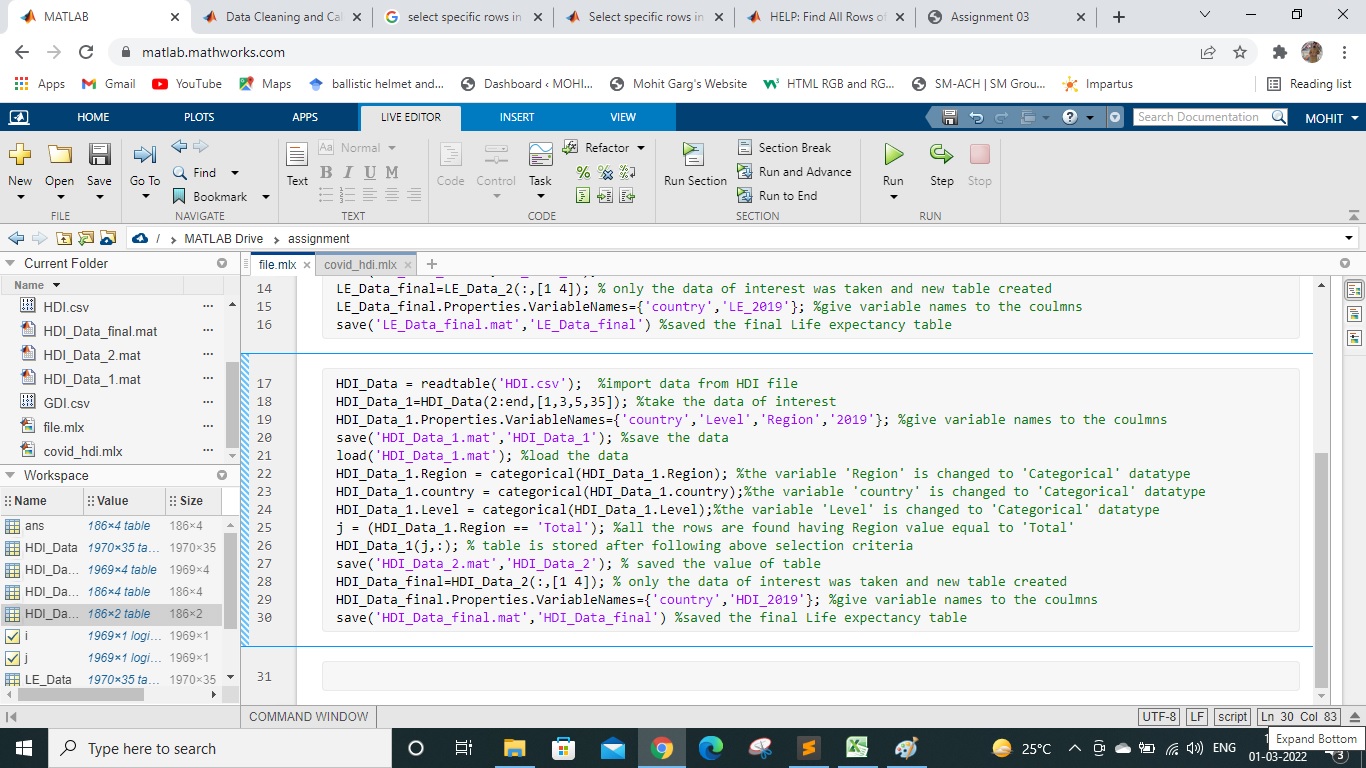
- Next step was to change the directory or to check the present working directory. Then the data of Life Expectancy was imported, cleaned and the selection was made on the data of interest.Here, we wished to display only the country wise data of life expectancy for the year 2019 and eliminate all the state or region wise data. All the commands used are shown in the image below. All the codes have been properly commented for better understanding.
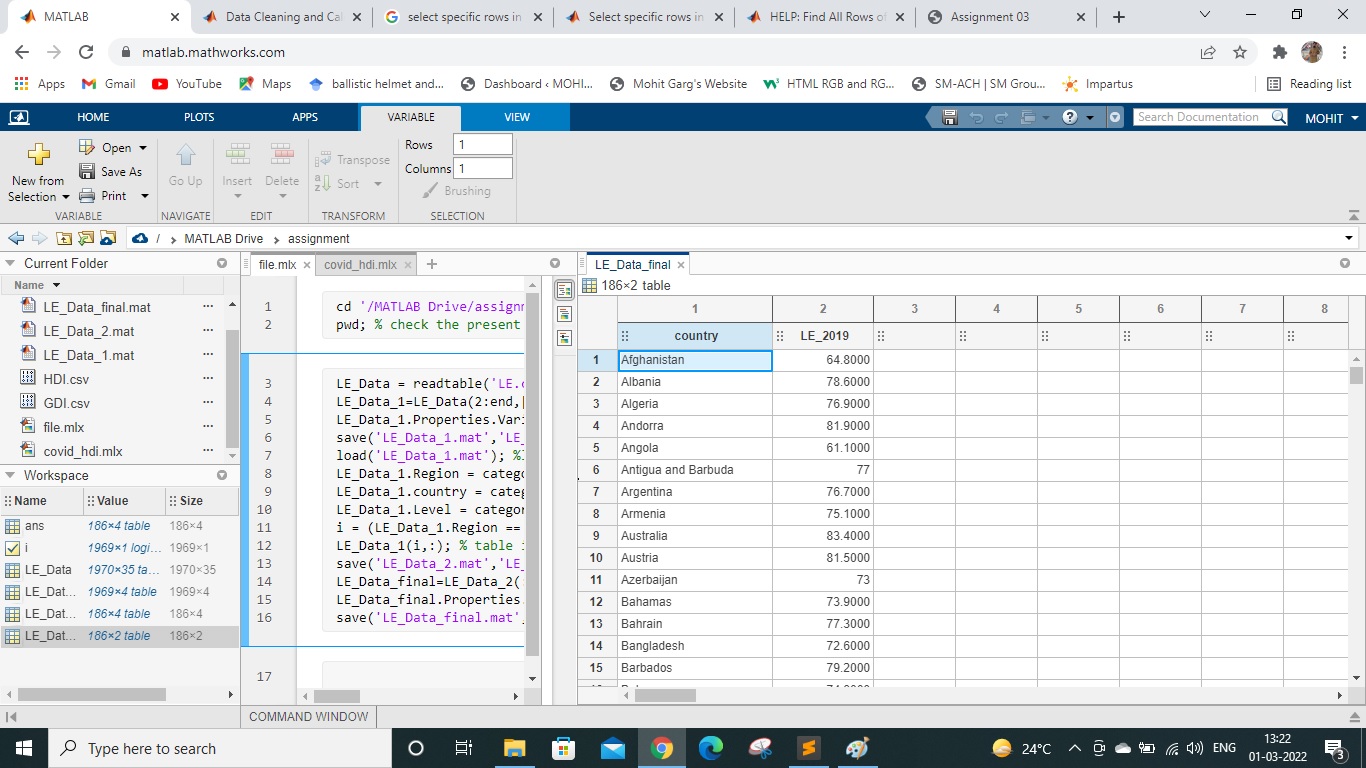
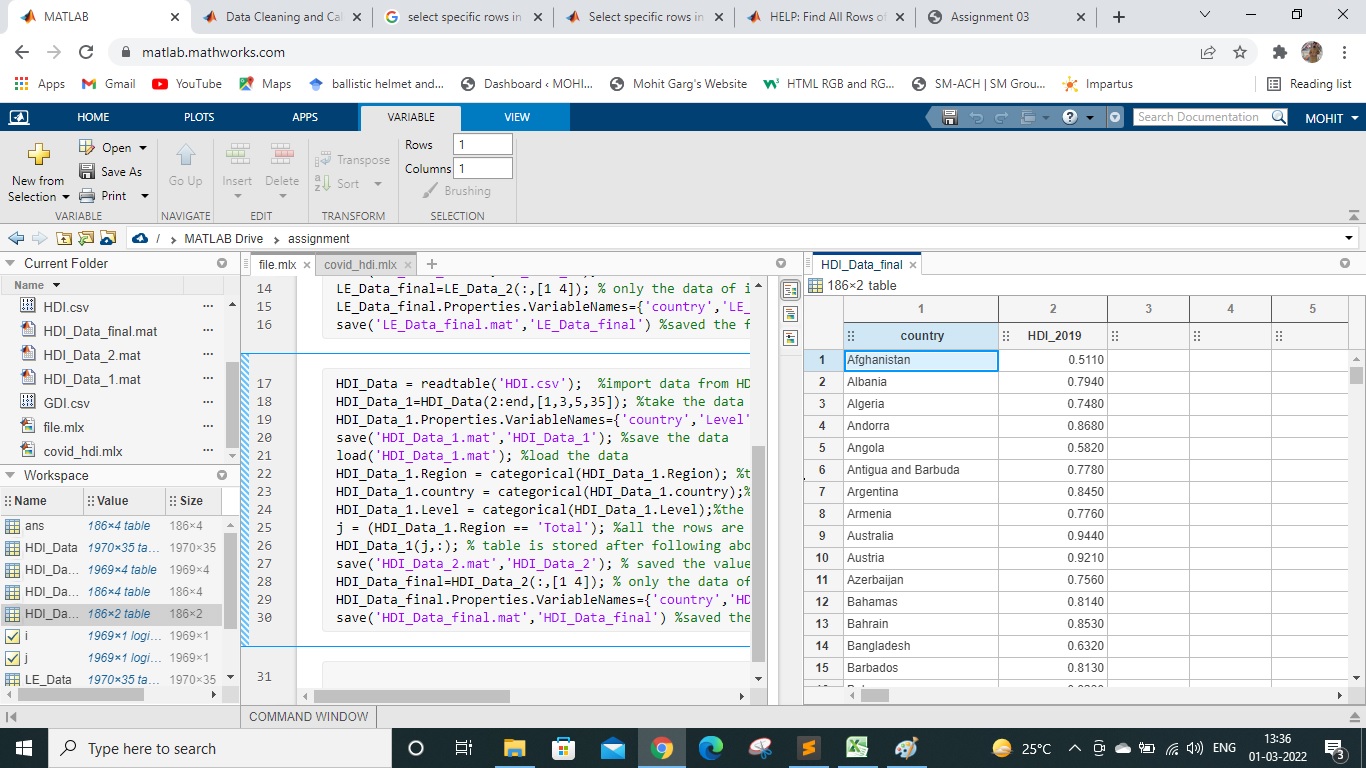
The output of the above table has been shown in the image below
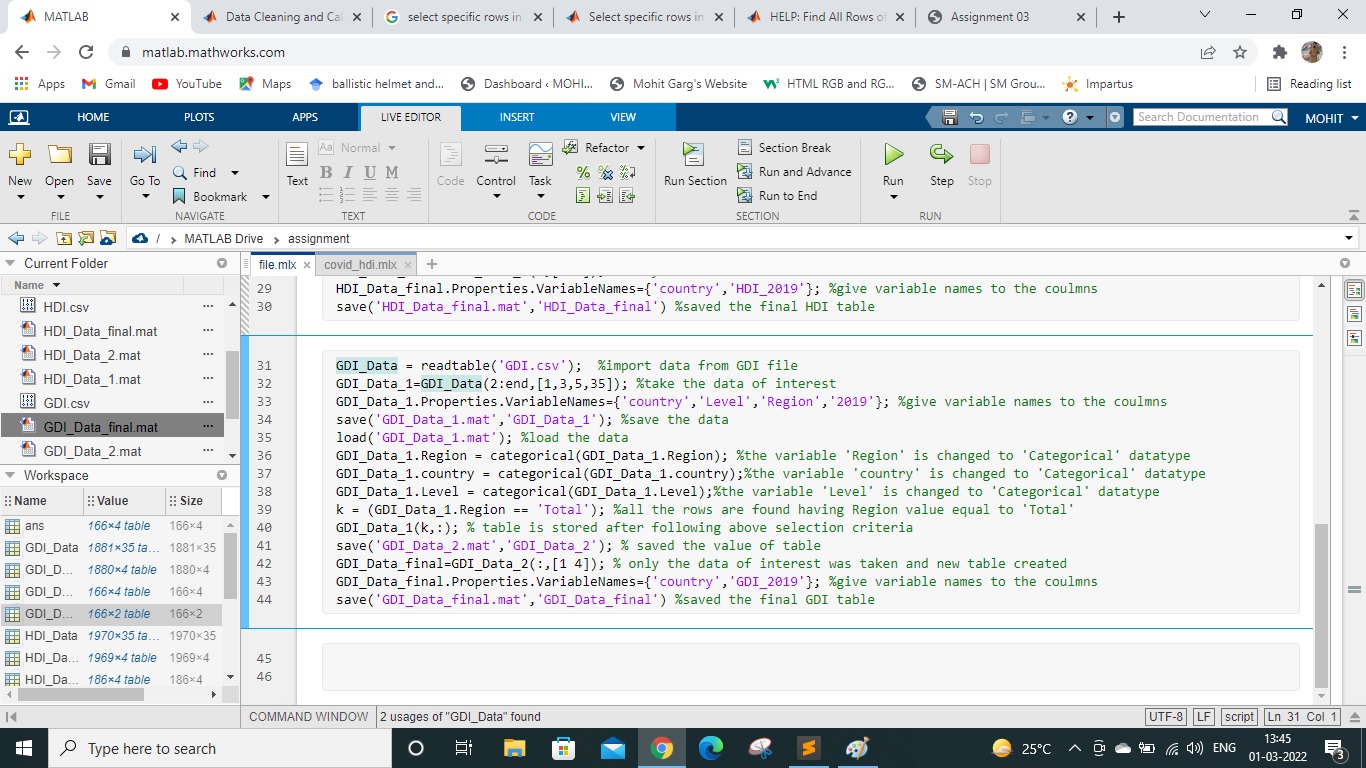
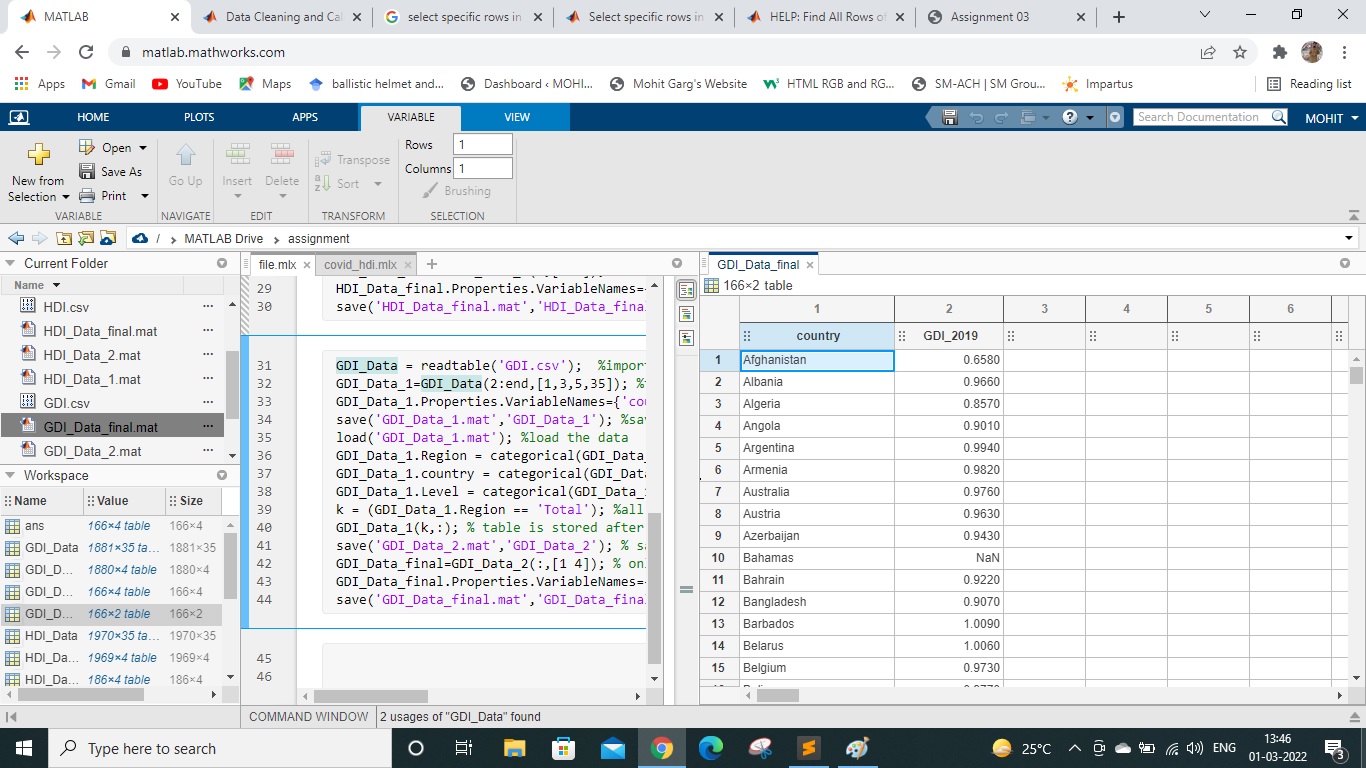
- Similar steps were followed for HDI data and GDI data. The images of commands and output have been shown in the images for both HDI and GDI files.
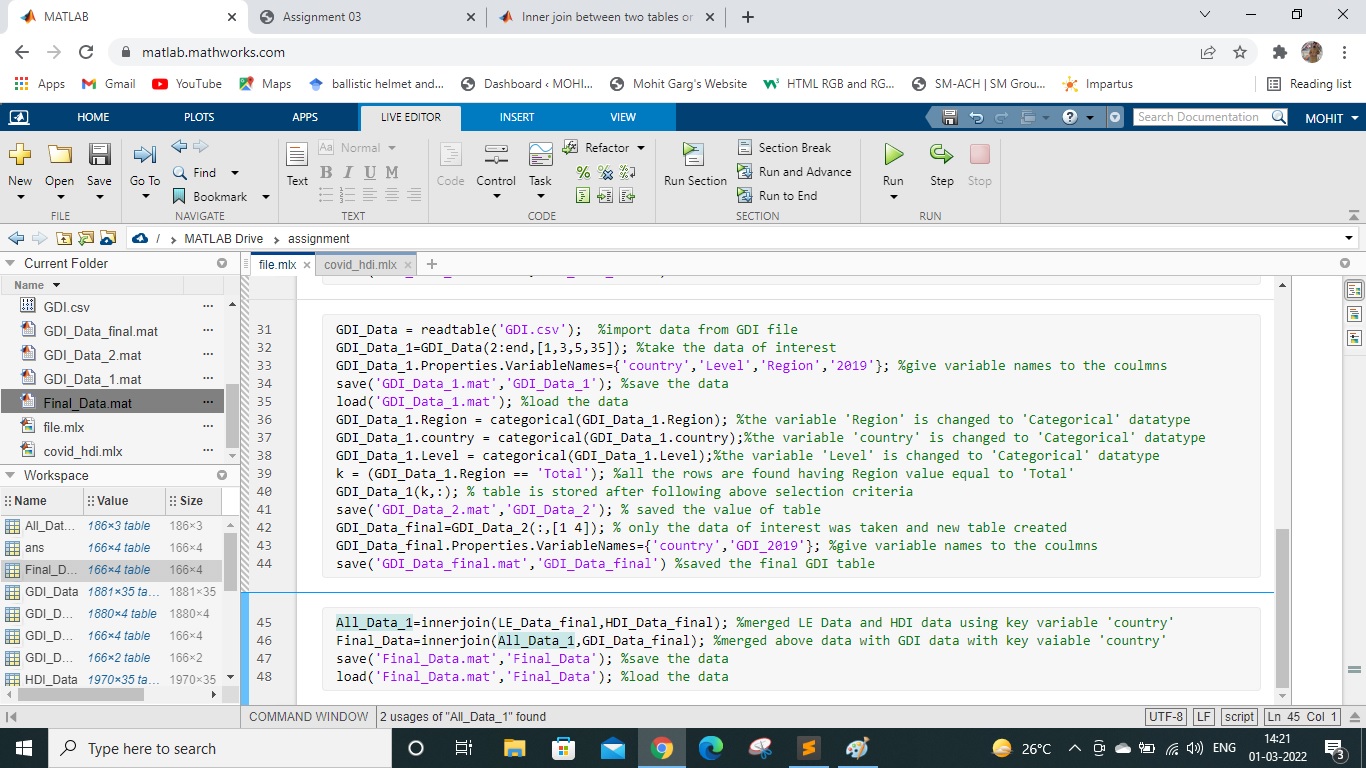
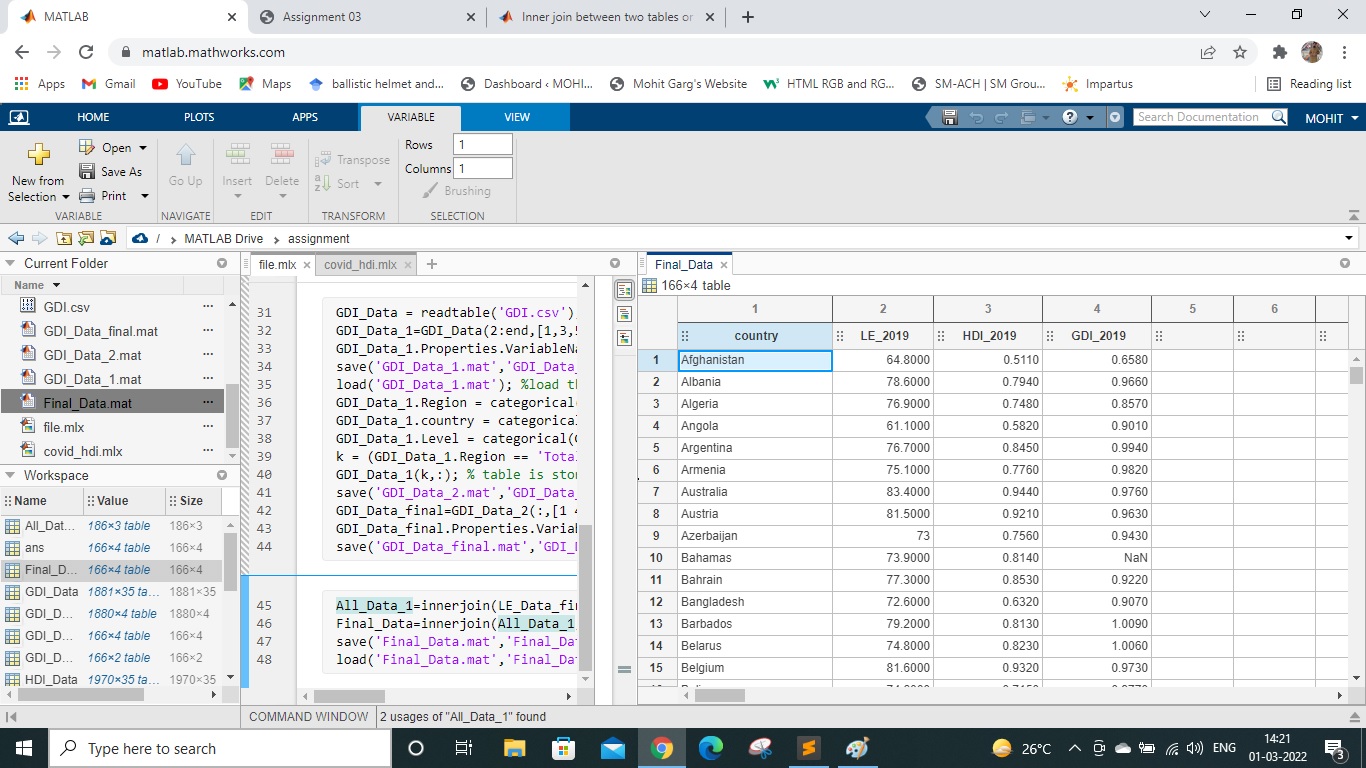
- Now we have cleaned and sorted the data as per our requirements. We now wish to join all the data into one single file.Firstly, LE Data and HDI data was merged using 'innerjoin' command and then the merged data was again merged with GDI data to obtain the 'Final_Data'. The merging was done using 'key variable' which was 'counrty' in this case. The commands and the output have been shown in the images below.
Learnings
This assignment helped in learning MATLAB as a data processing tool. This included importing the files in matlab, loading the data, changing the data type of the variables inside the data, sorting and selecting data of our choice and merging different datas as one file.
-----------------------------------------------------------------------------------------------------------------------------------THE END---------------------------------------------------------------------------------------------------------