01
Approach
The aim of the project was to build something using the concepts taught in class about data science. I
built a machine learning image classification model using CNN and Keras which recognises Traffic Sign Images.
You must have heard about the self-driving cars in which the passenger can fully depend on the car for traveling. But to achieve level 5 autonomous, it is necessary for vehicles to understand and follow all traffic rules.
In the world of Artificial Intelligence and advancement in technologies, many researchers and big companies like Tesla, Uber, Google, Mercedes-Benz, Toyota, Ford, Audi, etc are working on autonomous vehicles and self-driving cars. So, for achieving accuracy in this technology, the vehicles should be able to interpret traffic signs and make decisions accordingly.
02
What is traffic Signs Recognition?
There are several different types of traffic signs like speed limits, no entry,
traffic signals, turn left or right, children crossing, no passing of heavy vehicles,
etc. Traffic signs classification is the process of identifying which class a traffic
sign belongs to.
In this assignment, I have built a deep neural network model that can
classify traffic signs present in the image into different categories. With this model,
we are able to read and understand traffic signs which are a very important task for all
autonomous vehicles.
Here's a video recorded showing the working of the model and the dataset used:
03
The Dataset Used
For the training and the testing, I used a dataset available at Kaggle
Traffic Sign Dataset
The dataset contains more than 50,000 images of different traffic signs. It is further
classified into 43 different classes. The dataset is quite varying, some of the classes
have many images while some classes have few images. The size of the dataset is around
300 MB. The dataset has a train folder which contains images inside each class and a
test folder which I am for testing my model.
04
Building the Model
I used Keras, Matplotlib, Scikit-learn, Pandas, PIL and Image Classification to build this model.
The ‘train’ folder has 43 folders each representing a different class. The range of the folder is from 0 to 42. With the
help of the OS module, we iterate over all the classes and append images and their respective labels in the
data and labels list. The PIL library is used to open image content into an array.

Finally, I stored all the images and their labels into lists (data and labels).
I then convert the list into a numpy array for feeding to the model.
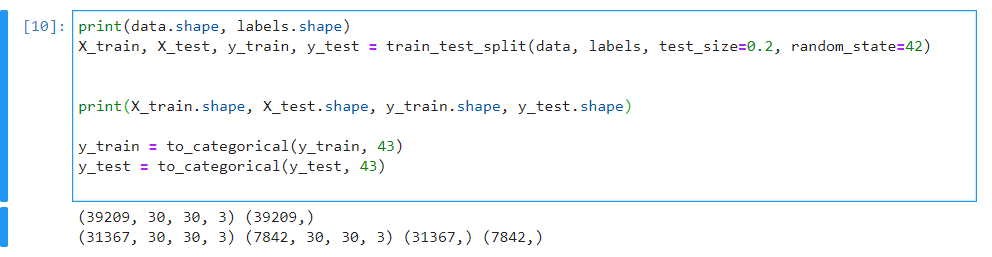
The shape of data is (39209, 30, 30, 3) which means that there are 39,209 images of size 30×30 pixels and the last 3 means the data contains colored images (RGB value).
With the sklearn package, I used the train_test_split() method to split training and testing data.
From the keras.utils package, I used to_categorical method to convert the labels present in y_train and t_test into one-hot encoding.
Building the CNN Model
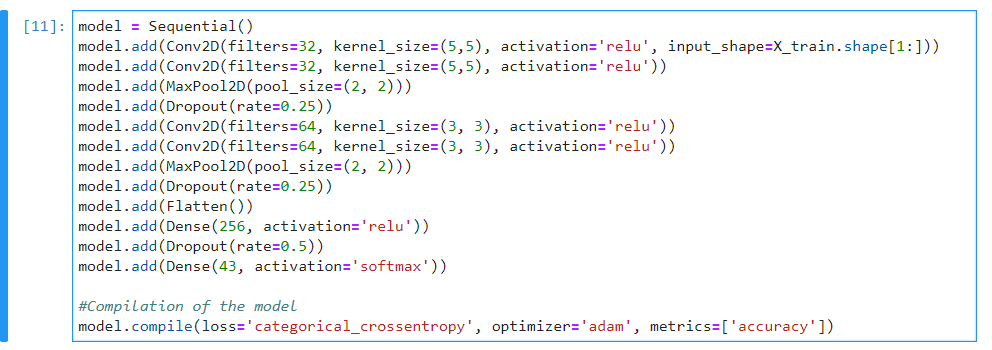
To classify the images into their respective categories, I built a CNN model (Convolutional Neural Network). CNN is best for image classification purposes.
The architecture of the model is:
2 Conv2D layer (filter=32, kernel_size=(5,5), activation=”relu”)
MaxPool2D layer ( pool_size=(2,2))
Dropout layer (rate=0.25)
2 Conv2D layer (filter=64, kernel_size=(3,3), activation=”relu”)
MaxPool2D layer ( pool_size=(2,2))
Dropout layer (rate=0.25)
Flatten layer to squeeze the layers into 1 dimension
Dense Fully connected layer (256 nodes, activation=”relu”)
Dropout layer (rate=0.5)
Dense layer (43 nodes, activation=”softmax”)
I compiled the model with Adam optimizer which performs well and loss is “categorical_crossentropy” because I had multiple classes to categorise.
04
Training and Validating The Model
After building the model architecture, I then trained the model using model.fit().
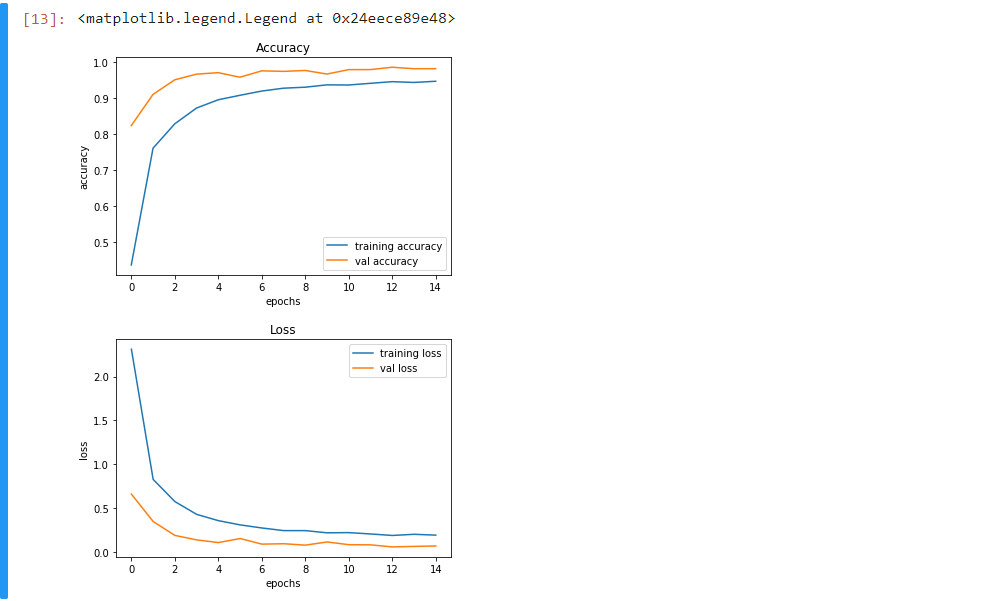
I tried with batch size 32 and 64. The model performed better with 64 batch size.
And after 15 epochs the accuracy was stable.
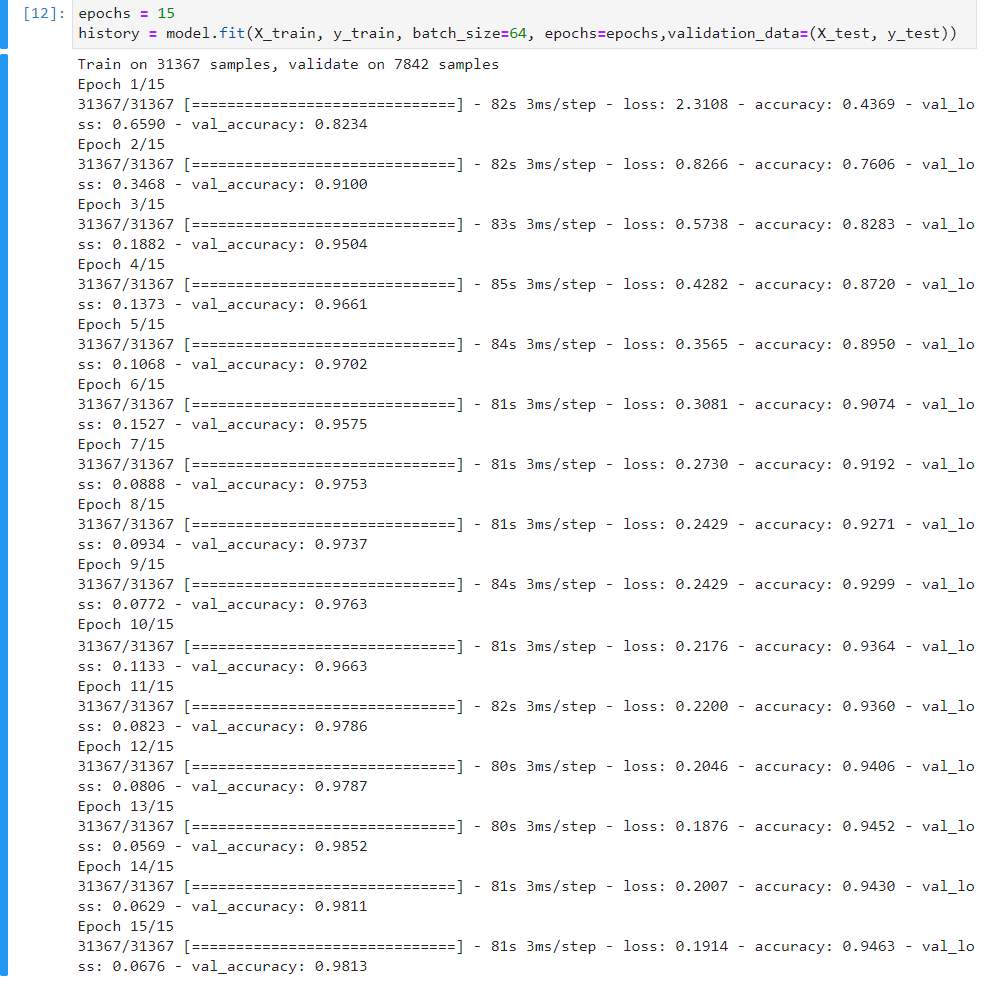
The model got a 95% accuracy on the training dataset. With matplotlib, I plotted the graph for accuracy and the loss.
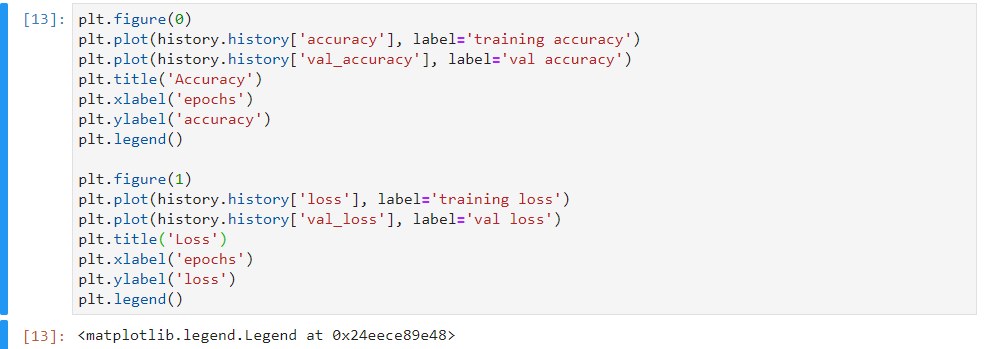
The resulting plot:
05
Test the model with test dataset
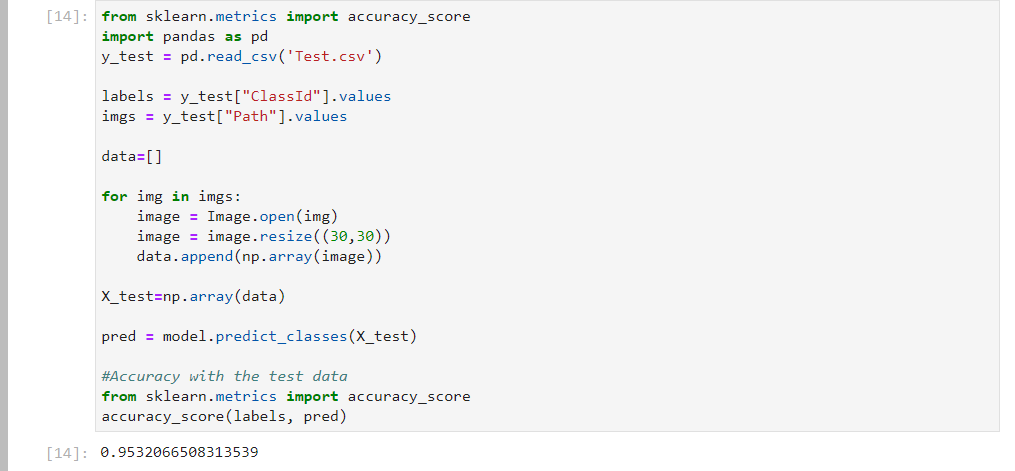
The dataset contains a test folder and in a test.csv file, I had the details
related to the image path and their respective class labels. I then extracted the
image path and labels using pandas. Then to predict the model, I had to resize
our images to 30×30 pixels and make a numpy array containing all image data. From
the sklearn.metrics, I then imported the accuracy_score and observed how the model
predicted the actual labels. I achieved a 95% accuracy in this model.
In the end, I saved the model that I trained using the Keras model.save() function.
06
Building a GUI
I then built a graphical user interface for our traffic signs classifier with Tkinter. Tkinter is a GUI toolkit in the standard python library.
I first loaded the trained model ‘traffic_classifier.h5’ using Keras. And then I build
the GUI for uploading the image and a button is used to classify which calls the
classify() function. The classify() function is converting the image into the dimension
of shape (1, 30, 30, 3). This is because to predict the traffic sign I have to provide
the same dimension I used when building the model. Then it predicts the class, the
model.predict_classes(image) returns us a number between (0-42) which represents the
class it belongs to. I used the dictionary to get the information about the class.
07
The Codes
The files for the model and the gui as as follows:
1. Traffic Sign Classifier Model
2. GUI Code