Statistics in Design - Problem Statement

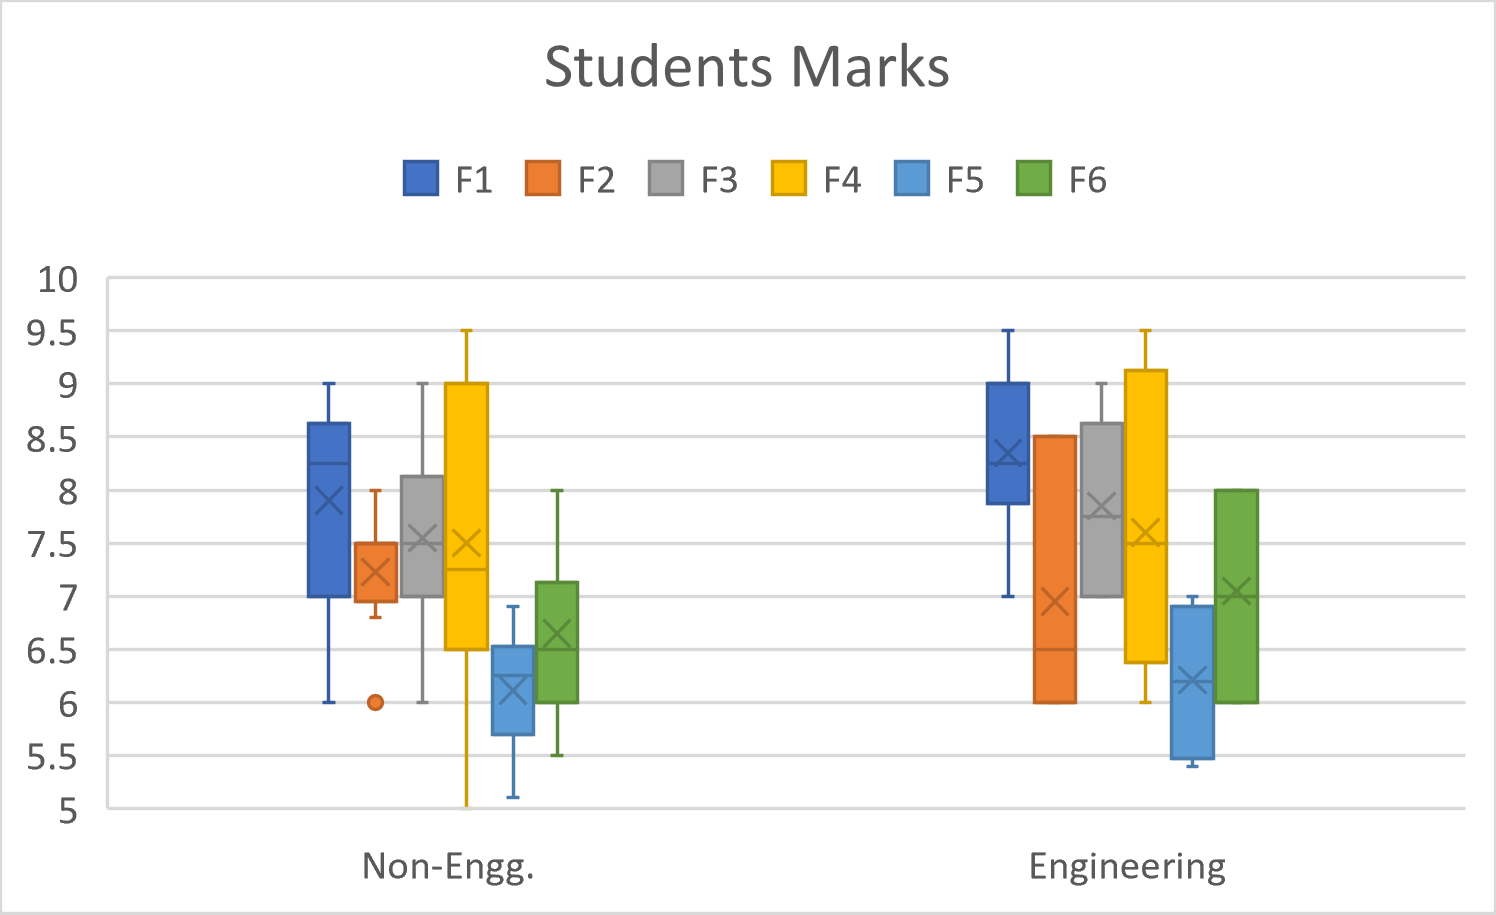
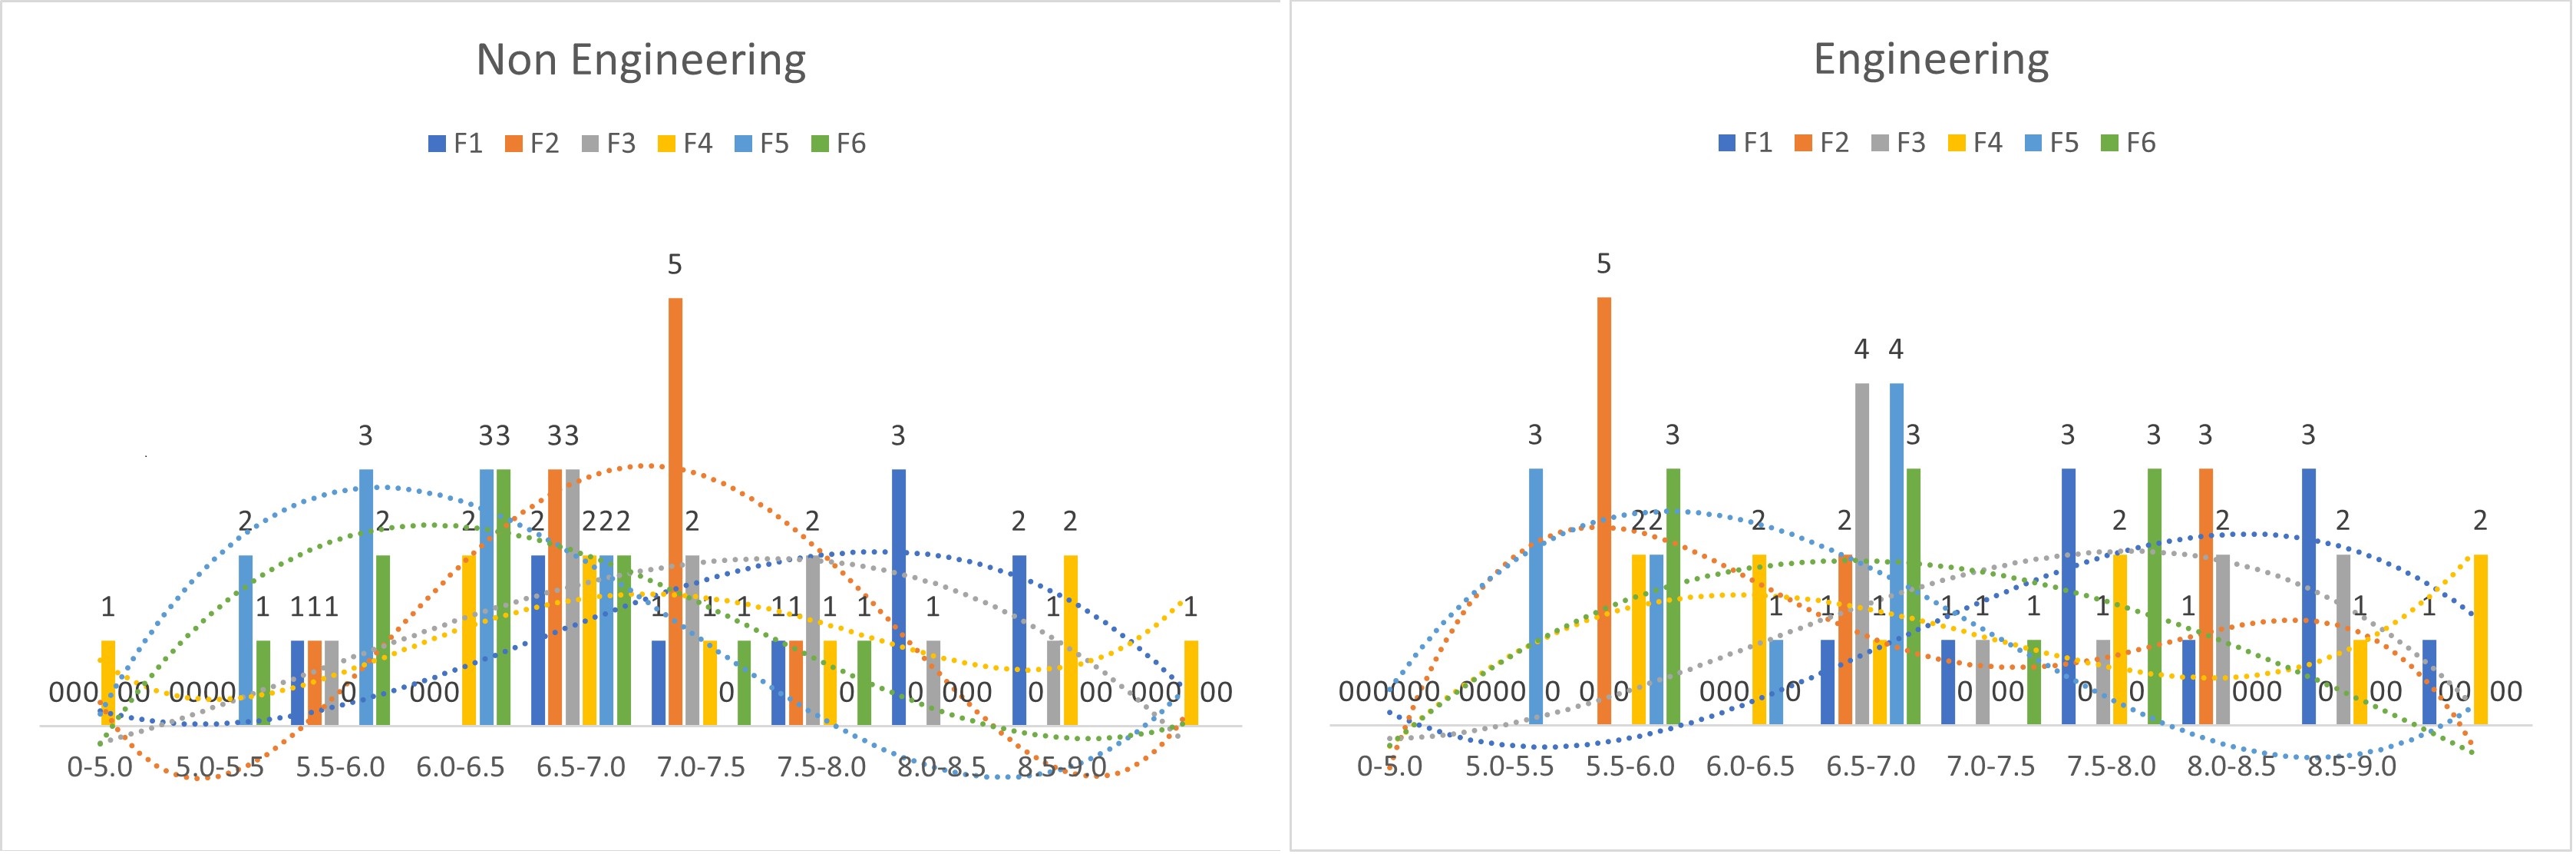
Above is the Problem Statement. Assignment goes like, finding any statistically significant difference between the marks given by different faculty to the students and What would be the comment on the marks received by the students of engg. vs. non-engg. orientation categories. Find if there any difference between the marks given by faculty to engg. vs. non-engg. students and Compute the Power (probability of avoiding a Type II error) of any of these comparisons and find out the sample size for which the Power >= 90%. Got to share any other insights that we have for this analysis and also visualize this data using box plots or other means. Have to show the calculations/ upload the code and/or the ANOVA tables involved.
ANOVA RESULTS
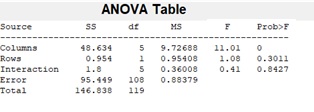
STATISTIC METHOD EXCEL VALIDATION
Anova & Oneway Anova were validated with Excel
Assignment 4 - In Excel
STATISTIC METHOD USING MATLAB
The Complete assignment has been uploaded here for ready references
Assignment 4 - In Matlab
Application In Real-World
Statistics finds its place in almost every day-today applications, few I have listed here.