

The sixth Assignment in DSL810: Prototyping in IoT, was about the applications of my knowledge of data science to present a solution to a real life problem. Based on the learnings through this course, I have chosen the problem of Housing Price Prediction for this assignment. I have explored the key features which are relevant for the price prediction as well as the model that best fits my solution.
Motivation for the problem
Housing prices are an important reflection of the economy, and housing price ranges are of great interest for both buyers and sellers. Ask a home buyer to characterize their dream house, and they would certainly not start with the basement ceiling height or proximity to an east-west railroad. But these are very important factors in shaping price negotiations of the house rather than just the number of bedrooms or a white picket fence. A data scientist's job is to accurately estimate a house's price based on the relevant features. The assignment is based on the Kaggle Housing Prices Competition, which, along with the price label, includes a list of different house attributes. The goal is to create a model that can predict the price of the house based on the available data.

Data Used
I've used the dataset available online at Kaggle. 2 files we provided on the website:
Data Fields given in the training dataset:
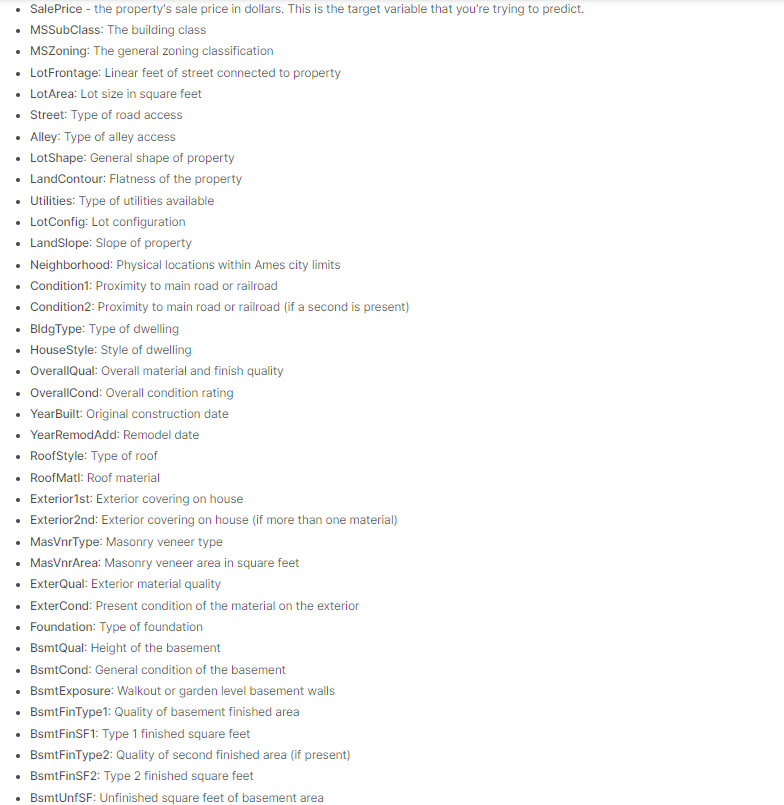
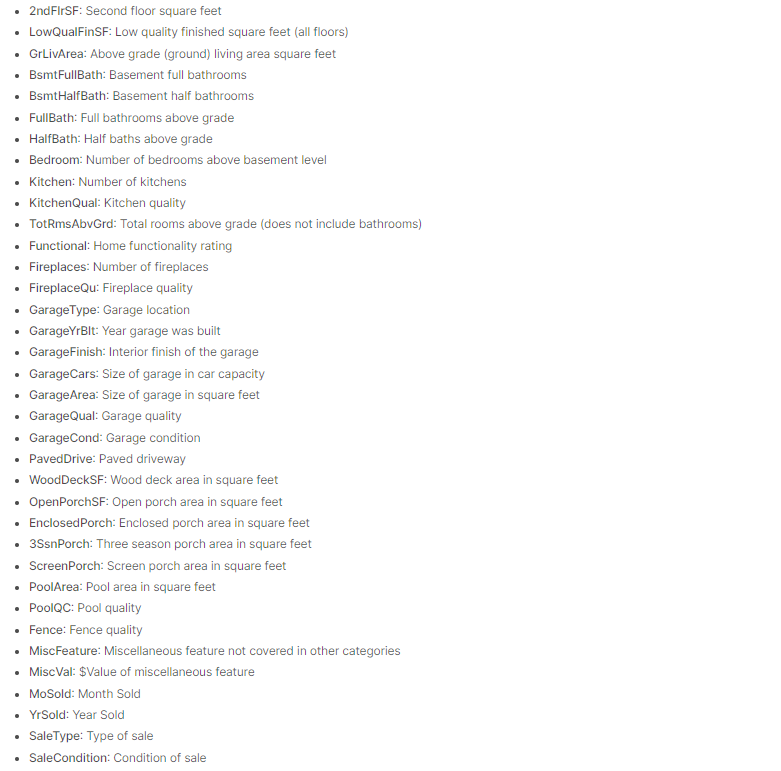
There were a total of 80 attributes given for the data. Out of the 80 attributes, one is the target (SalePrice) that the model should predict. Hence, there are 79 attributes that may be used for feature selection/engineering.
The job is to understand the importance that each of this attribute plays in predicting the price of a house, and accurately build a model selecting the right attributes to predict the price of houses given in test.csv file.
Code
Below is the entire code for this assignment written in Jupiter Notebook exported as an html file:
Housing Price Prediction ML Code
Approach: Explaining the Code
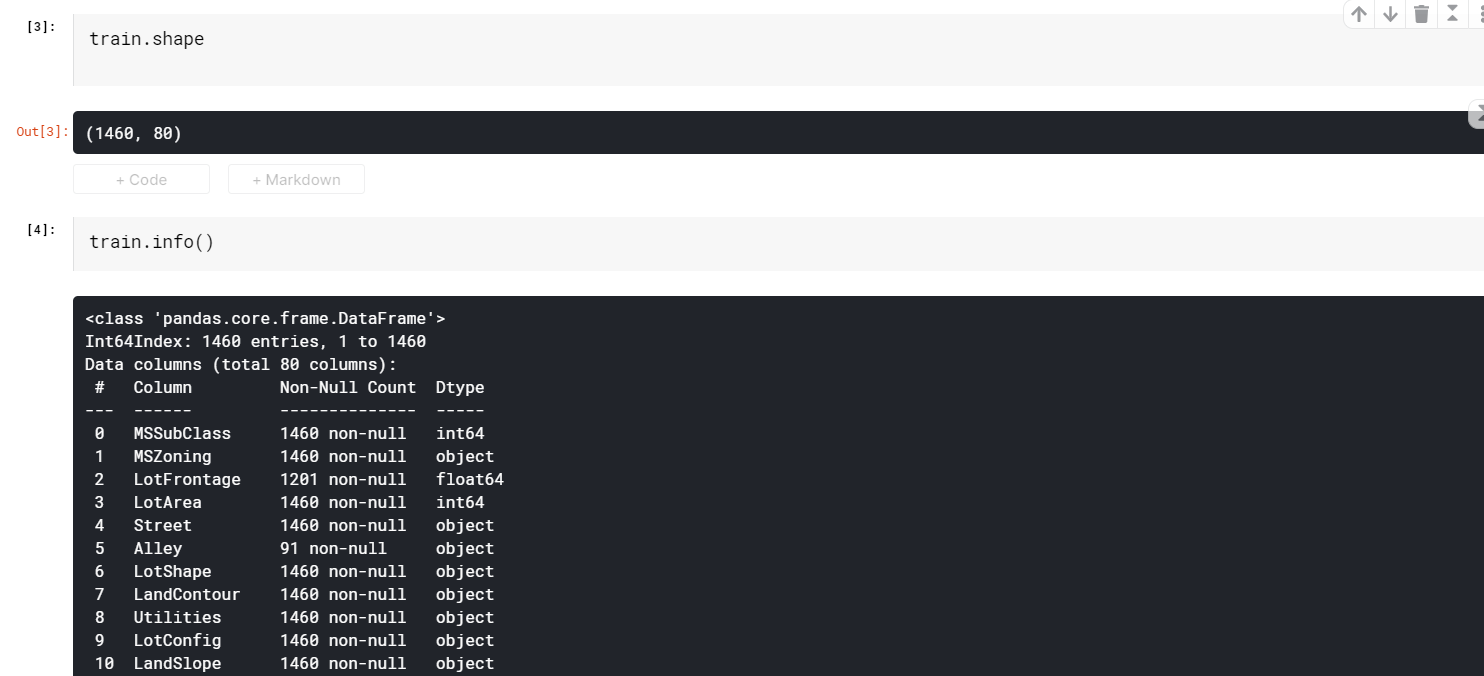
First task was to examine the data closely to figure out the key features and how they influence the price of the house. The "shape" of the dataset shows that it has 1460 rows/instances, with data from 80 attributes.
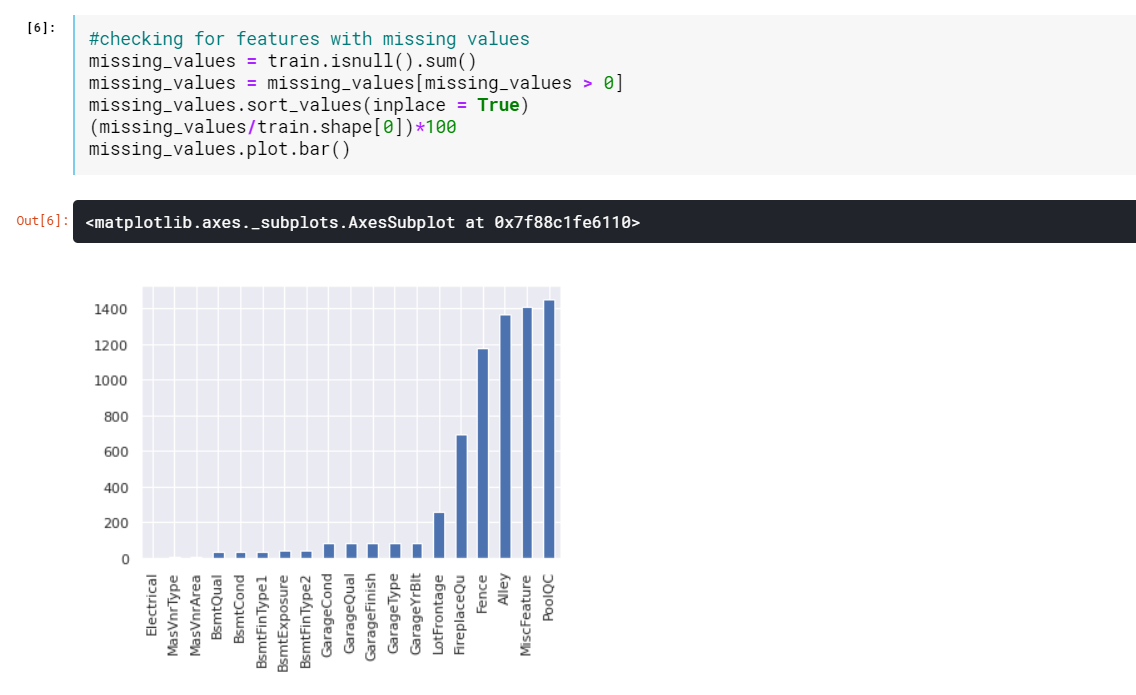
Checking the features for identifying how many missing vakues are present in each of them:
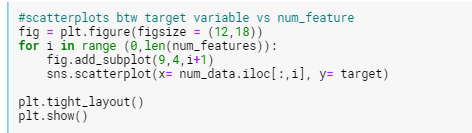
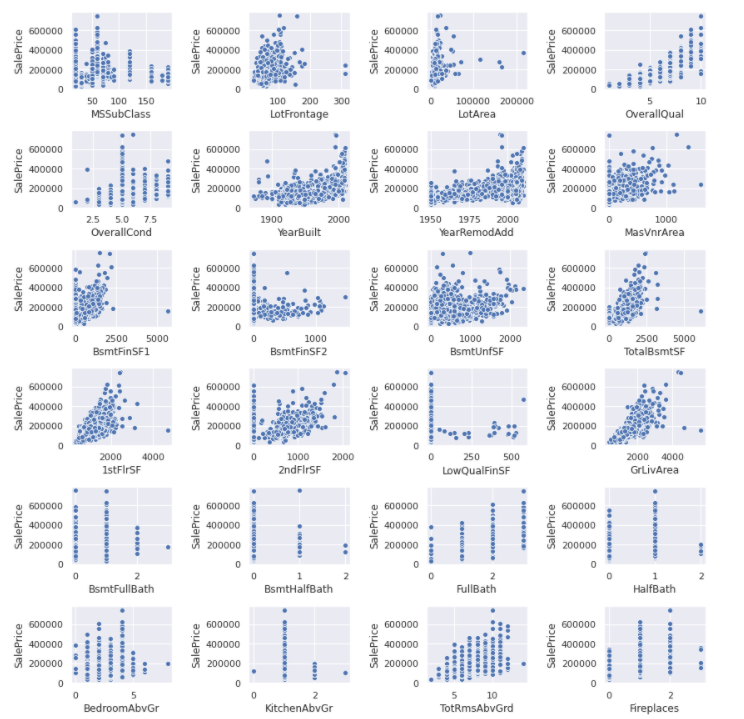
Exploratory Data Analysis
• To gain a preliminary understanding of available data
• Check for missing or null values
• Find potential outliers
• Assess correlations amongst attributes/features
• Check for data skew
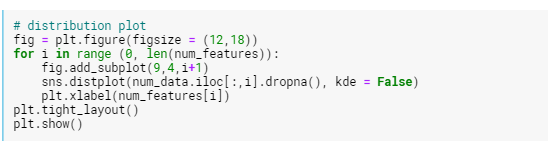
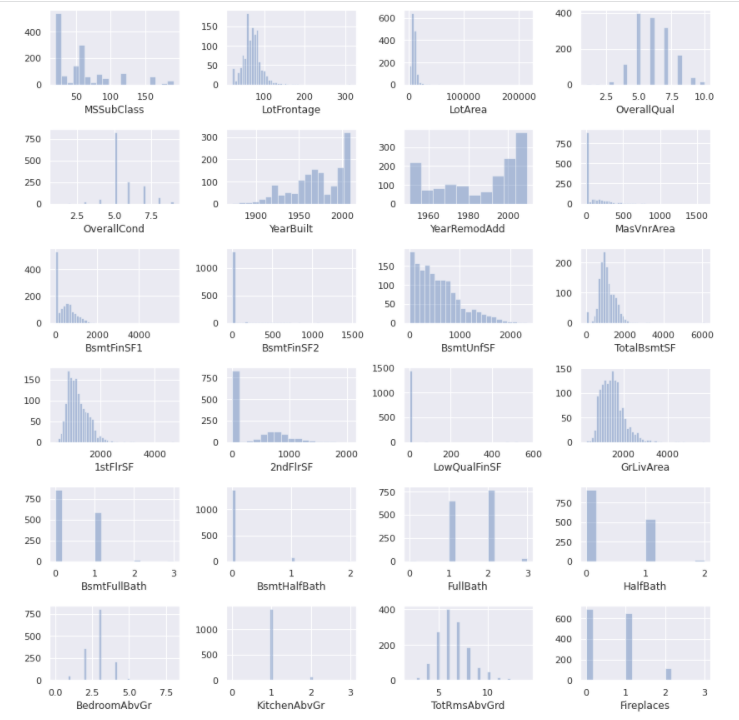
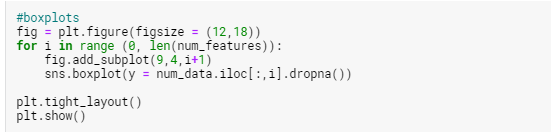
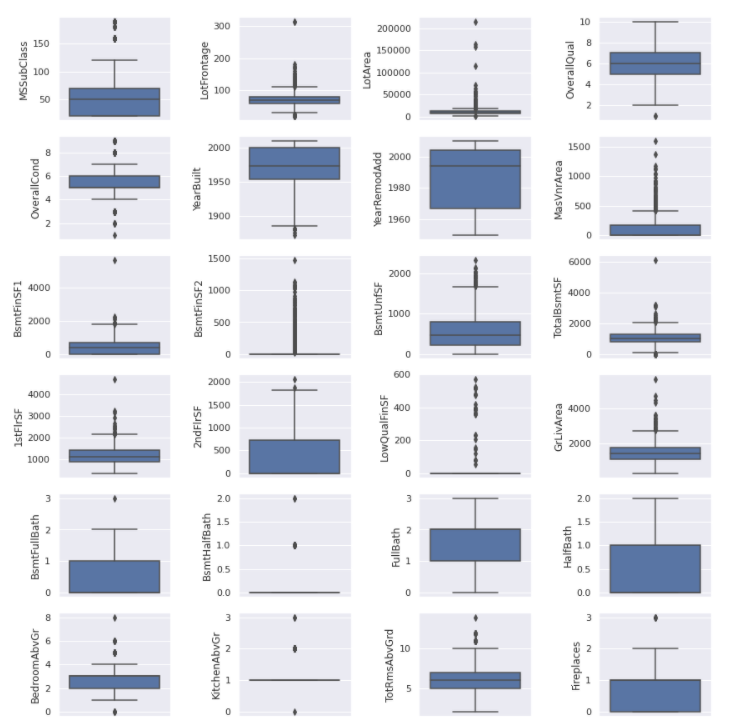
Finding Outliers
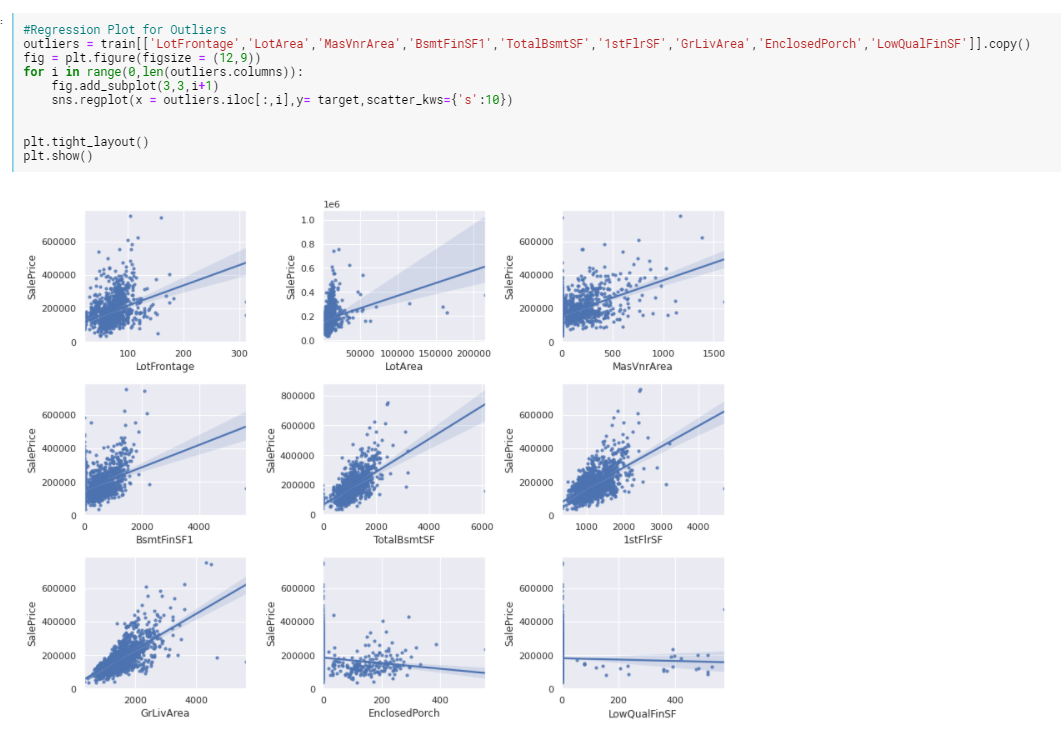
Features with Outliers:
• LotFrontage
• LotArea
• MasVnrArea
• BsmtFinSF1
• TotalBsmtSF
• 1stFlrSF
• GrLivArea
• EnclosedPorch
• LowQualFinSF
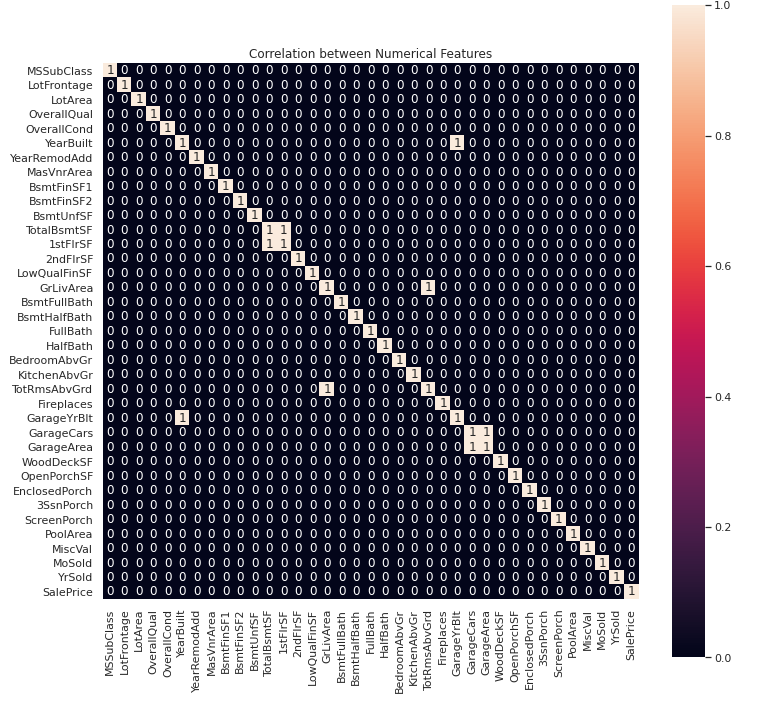
The linear correlation between two columns of data is shown below. There are various correlation calculation methods, but the Pearson correlation is often used and is the default method. It may be useful to note that:
• A combination of the correlation figure and a scatter plot can support the understanding of whether there is a non-linear correlation (i.e. depending on the data, this may result in a low value of linear correlation, but the variables may still be strongly correlated in a non-linear fashion)
• Correlation values may be heavily influenced by single outliers!
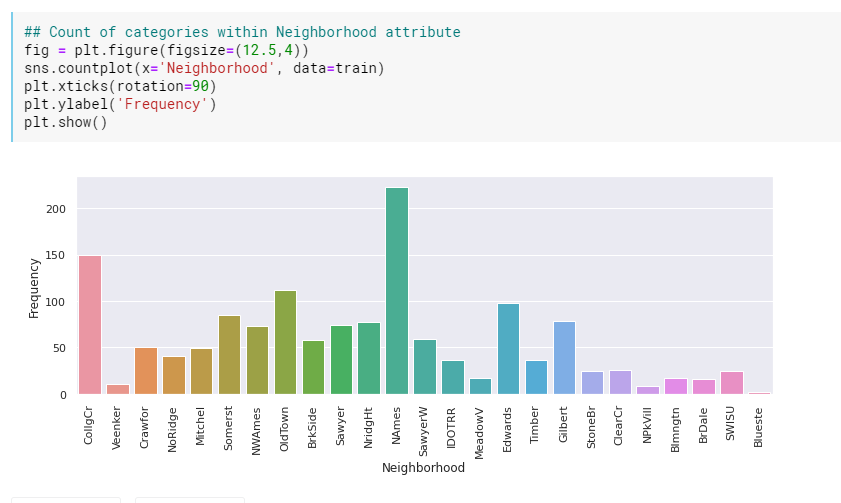
Exploring Categorical Coloumn:
Machine Learning Model
For the assignmemnt, I've used 2 machine learning models: Linear Regression and Random Forest Regression, and have compared the accuracy for both.
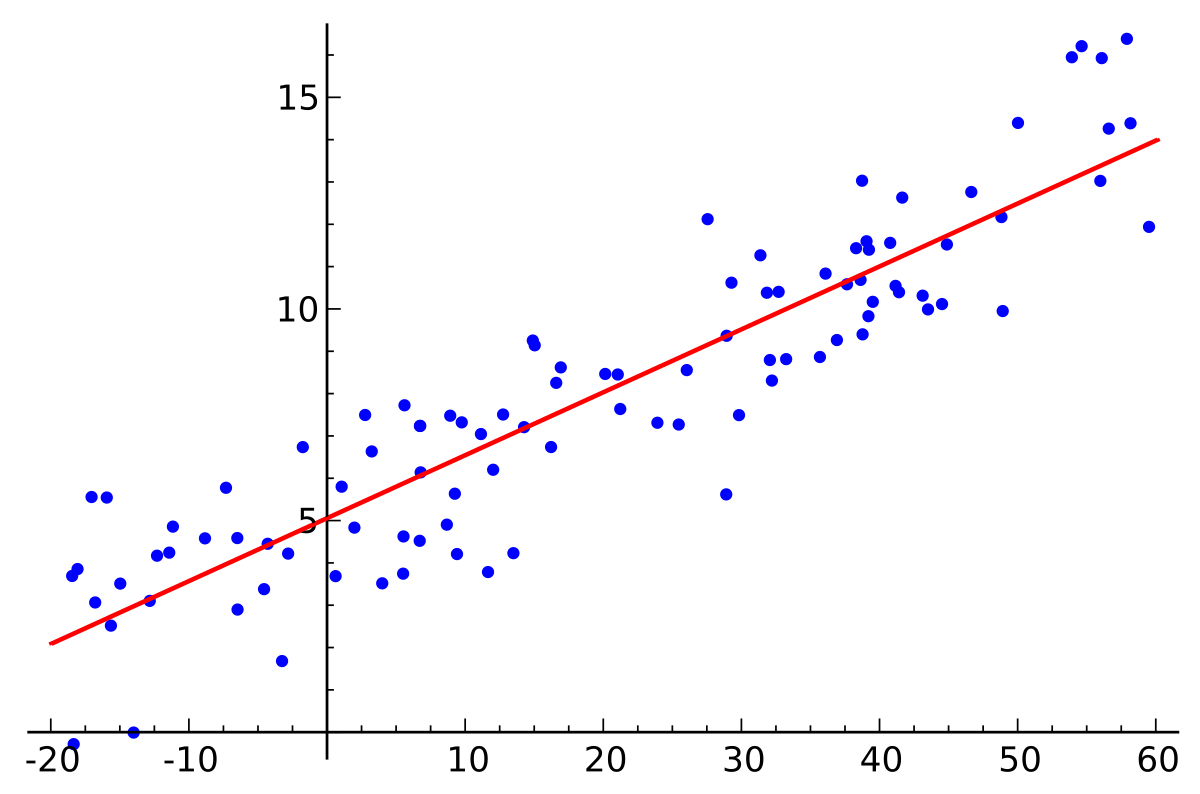
Linear Regression: In statistical modeling, regression analysis is a set of statistical processes for estimating the relationships between a dependent variable and one or more independent variables.
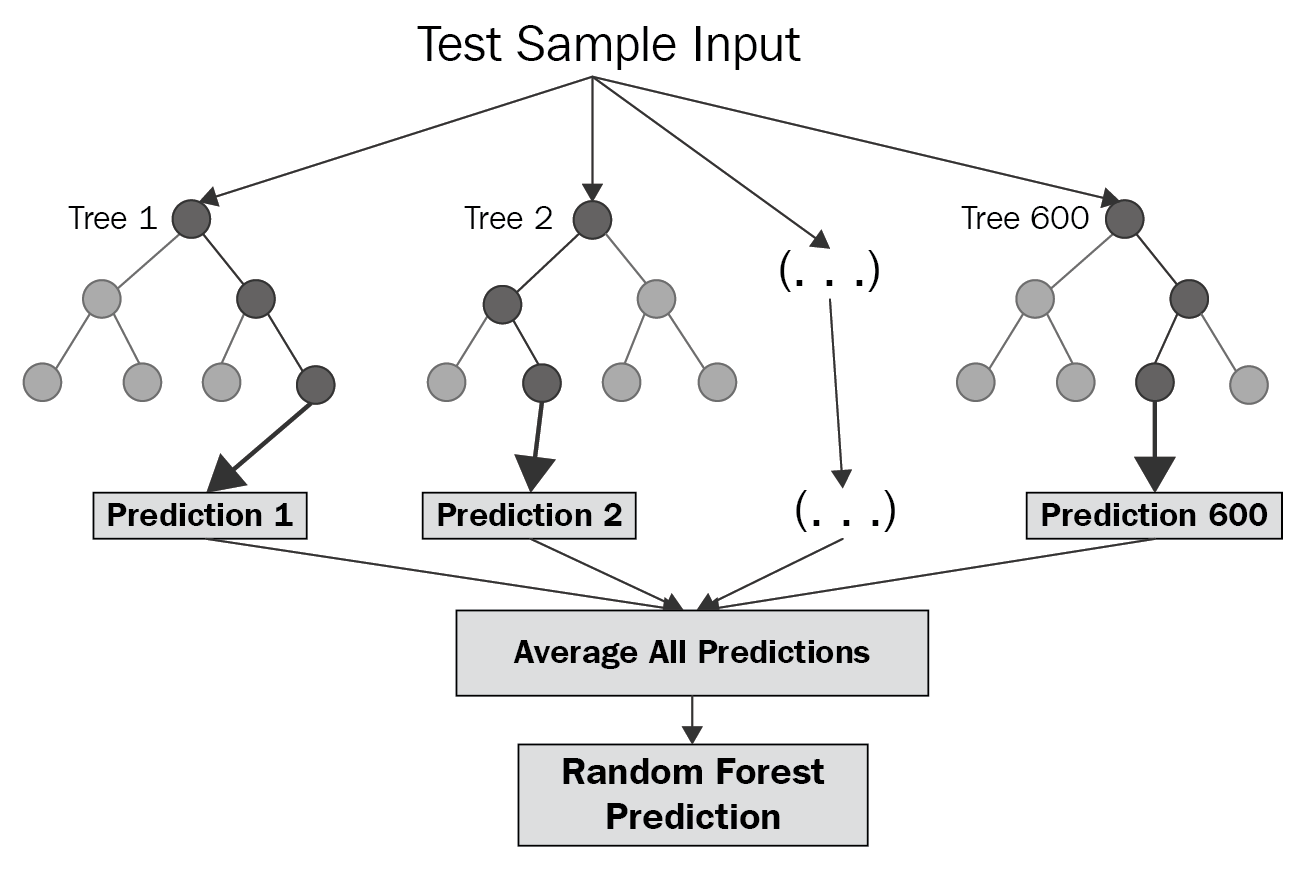
Random Forest Regression: Random forests or random decision forests are an ensemble learning method for classification, regression and other tasks that operate by constructing a multitude of decision trees at training time and outputting the class that is the mode of the classes (classification) or mean prediction (regression) of the individual trees.
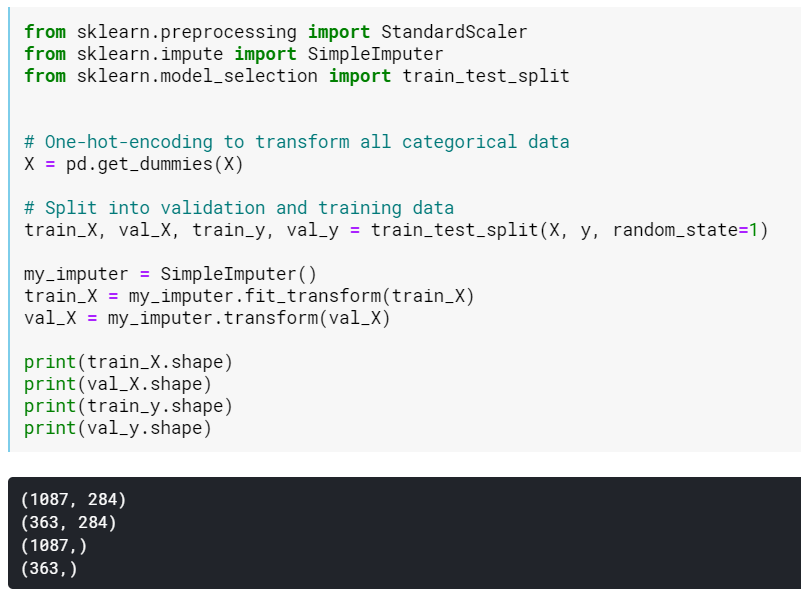
Train-Test Split:
Importing the models from library:

Results Achieved
I trained both of the models as shown in the screenshot below. For validating the model, I calculated Mean Absolute Error (MAE) for both of the models. The more accurate a model is, the less is the Mean Absolute Error for it.
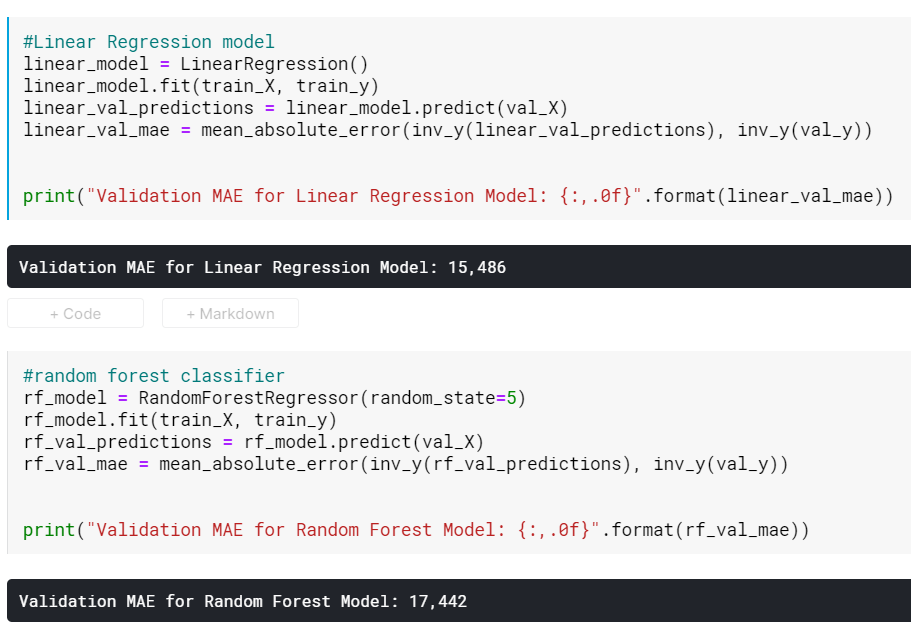
It was found that:
Validation MAE for Linear Regression Model: 15,486
Validation MAE for Random Forest Model: 17,442
As the Mean Absolute Error for Linear Regression is less than that of the Random Forest Model, I can conclude that the former is better for prediction the price of the house.
Insights Gained
From the exploratory data analysis performed on the training dataset, it was found the features like PoolQC, MiscFeatures, Alley, Fence were absent in most of the cases. Hence they were not important in predicting the final price of the house. I identified corelation between the features as feeding highly-correlated features to machine algorithms may cause a reduction in performance. It was found that highly-correlated attributes include:
• GarageYrBlt & YearBuilt
• 1stFloorSF & TotalBsmtSF
• TotRmsAbvGrd & GrLivArea
• GarageArea & GarageCars
I also got to understand that for this assignment, Linear Regression Model is a better model to predict the results accurately, as compared to the Random Forest Model, as the Mean Absolute Error is relatively less for it.
Future Work to improve upon
For exploratory data analysis, I was able to assess the numerical data efficiently. However, improvements can be made for the assessment of categorical data present in the dataset. I can explore pros and cons of other methods to encode categorical attributes, besides one-hot encoding. I can also consider scikit-learn's PowerTransformer preprocessing module to fit and transform columns to be more Gaussian-like. Moreover, I can think about possible combination of attributes to create useful new features, including polynomials.